So recently I adapted Kelsey Hightower’s Standalone Kubelet Tutorial for Raspberry Pi.
Standalone Kubelet Tutorial for Raspberry Pi is a prerequisite for this tutorial, as I’m going to skip Linux installation and all the other parts.
In this tutorial I will show you how to cross compile Kubernetes Kubelet to ARM architecture and we will run the amazing Prometheus, Node Exporter and Grafana using static pods.
I am running Ubuntu, so this should generally work for people running Ubuntu or other Linux distributions. If you are running Windows I have no idea whether this will work, but you can try 🙂 I think there could be issues in building Kubelet and/or cross compiling it for ARM.
You should subsitute IP for your Raspberry Pi’s IP address or hostname.
Compiling Kubernetes Kubelet for arm
Clone the Kubernetes project:
git clone [email protected]:kubernetes/kubernetes.git
You can checkout specific version branch if you like (e.g. git checkout release-1.10), I will be running master in this tutorial.
Compile Kubernetes for ARM:
cd kubernetes
Build Kubernetes for your current platform:
make
To cross compile you will need to have gcc-arm-linux-gnueabihf package installed.
On Ubuntu/Debian you can install via:
sudo apt-get install gcc-arm-linux-gnueabihf
Cross compile Kubelet for ARM:
make all WHAT=cmd/kubelet KUBE_BUILD_PLATFORMS=linux/arm
Copy Kubelet binary to your Raspberry Pi:
scp ./_output/local/bin/linux/arm/kubelet IP:~/
Installing Kubelet
Connect to Raspberry Pi:
ssh alarm@IP
Move Kubelet to /usr/bin:
sudo mv kubelet /usr/bin/kubelet
Download Kubelet’s config file and create /etc/kubernetes from previous tutorial, if you haven’t already.
Download the Kubelet systemd file:
wget -q --show-progress --https-only --timestamping \
  https://raw.githubusercontent.com/povilasv/advanced-raspberrypi-standalone-kubelet/master/kubelet.service
Move the kubelet.service unit file to the systemd configuration directory:
sudo mv kubelet.service /etc/systemd/system/
Start the kubelet service:
sudo systemctl daemon-reload

sudo systemctl enable kubelet

sudo systemctl start kubelet
Verification
Verify the kubelet is running:
sudo systemctl status kubelet
View logs for Kubelet service:
journalctl -u kubelet
Check that no containers are running:
docker ps
Installing Prometheus and friends
Prometheus
Create Prometheus data dir:
sudo mkdir /root/prometheus-data/
Download Prometheus config:
wget -q --show-progress --https-only --timestamping \
  https://raw.githubusercontent.com/povilasv/advanced-raspberrypi-standalone-kubelet/master/config/prometheus.yml
Move prometheus.yml to /root/prometheus-data/:
sudo mv prometheus.yml /root/prometheus-data/prometheus.yml
Download Prometheus manifest:
wget -q --show-progress --https-only --timestamping \
  https://raw.githubusercontent.com/povilasv/advanced-raspberrypi-standalone-kubelet/master/pods/prometheus.yaml
Move the prometheus.yaml pod manifest to the Kubelet manifest directory:
sudo mv prometheus.yaml /etc/kubernetes/manifests/prometheus.yaml
Wait for image to download and list containers:
docker ps
You should see two containers running which represent the
prometheuspod and akubeletcontainer. Docker does not understand pods so the containers are listed as individual containers following the Kubernetes naming convention.
Open up browser and go to:
http://IP:9090/status
You should see Prometheus WEB UI.
Open up targets page:
http://ip:9090/targets
You should see 1 job as UP, and 2 jobs as DOWN. This is expected as we haven’t launched node exporter and grafana yet.
Node Exporter
Download Prometheus Node Exporter manifest:
wget -q --show-progress --https-only --timestamping \
  https://raw.githubusercontent.com/povilasv/advanced-raspberrypi-standalone-kubelet/master/pods/nodeexporter.yaml
Move the nodeexporter.yaml pod manifest to the Kubelet manifest directory:
sudo mv nodeexporter.yaml /etc/kubernetes/manifests/nodeexporter.yaml
Wait for image to download and list containers:
docker ps
You should see additional two containers running which represent the
node exporterpod.
Open up Prometheus targets page:
http://ip:9090/targets
You should see 2 jobs as UP, and 1 job as DOWN.
Grafana
Download Grafana manifest:
wget -q --show-progress --https-only --timestamping \
  https://raw.githubusercontent.com/povilasv/advanced-raspberrypi-standalone-kubelet/master/pods/grafana.yaml
Move the grafana.yaml pod manifest to the Kubelet manifest directory:
sudo mv grafana.yaml /etc/kubernetes/manifests/grafana.yaml
Wait for image to download and verify it is running:
docker ps
You should see additional two containers running which represent the
grafanapod.
Open up Prometheus targets page:
http://ip:9090/targets
You should see 3 jobs as UP.
Go to Grafana page:
http://IP:3000/login

Enter `admin`/`admin`.
Add data source:
Click on Add Source and enter:

Name: prom
URL: http://127.0.0.1:9090
Access: proxy
Scrape interval: 30s
Adding dashboards:
Click on Dashboards tab in `add data source page`:
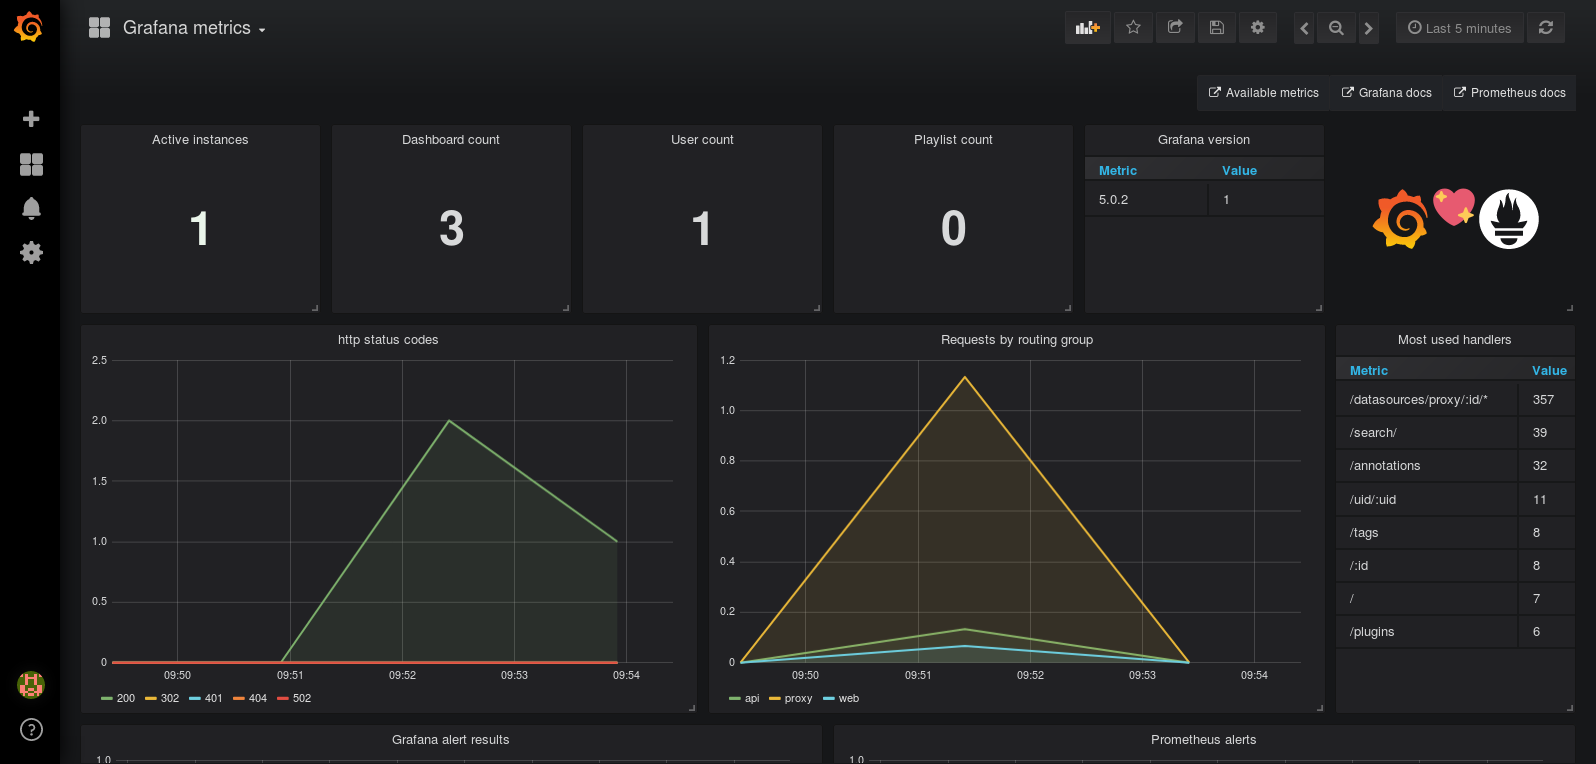
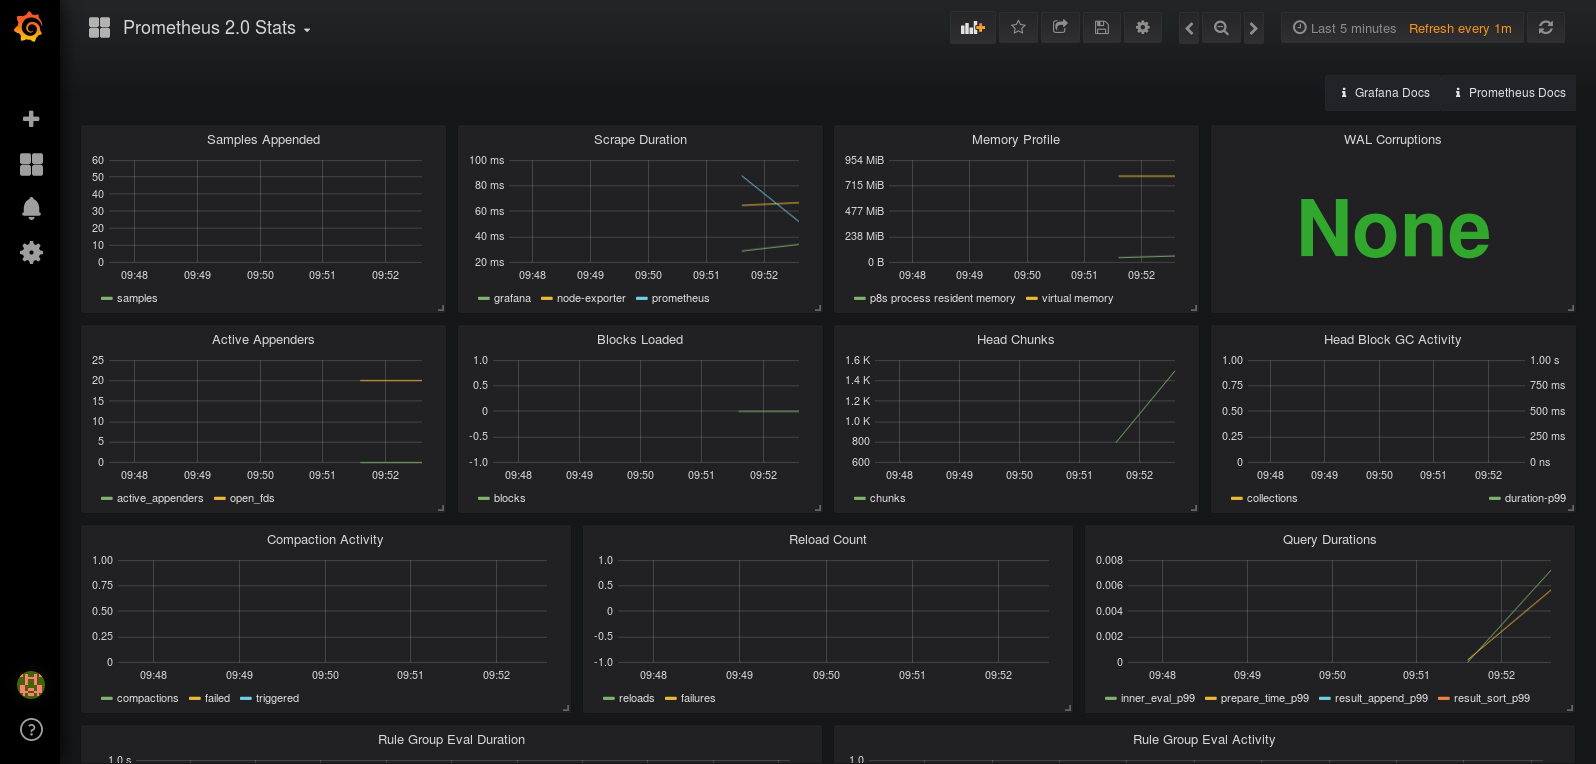
Import `Prometheus 2.0 Stats` and `Grafana metrics` dashboards.
Hover on a left `+` button and click `Import`.
Enter `5573`.
Set `prometheus` as `prom`.
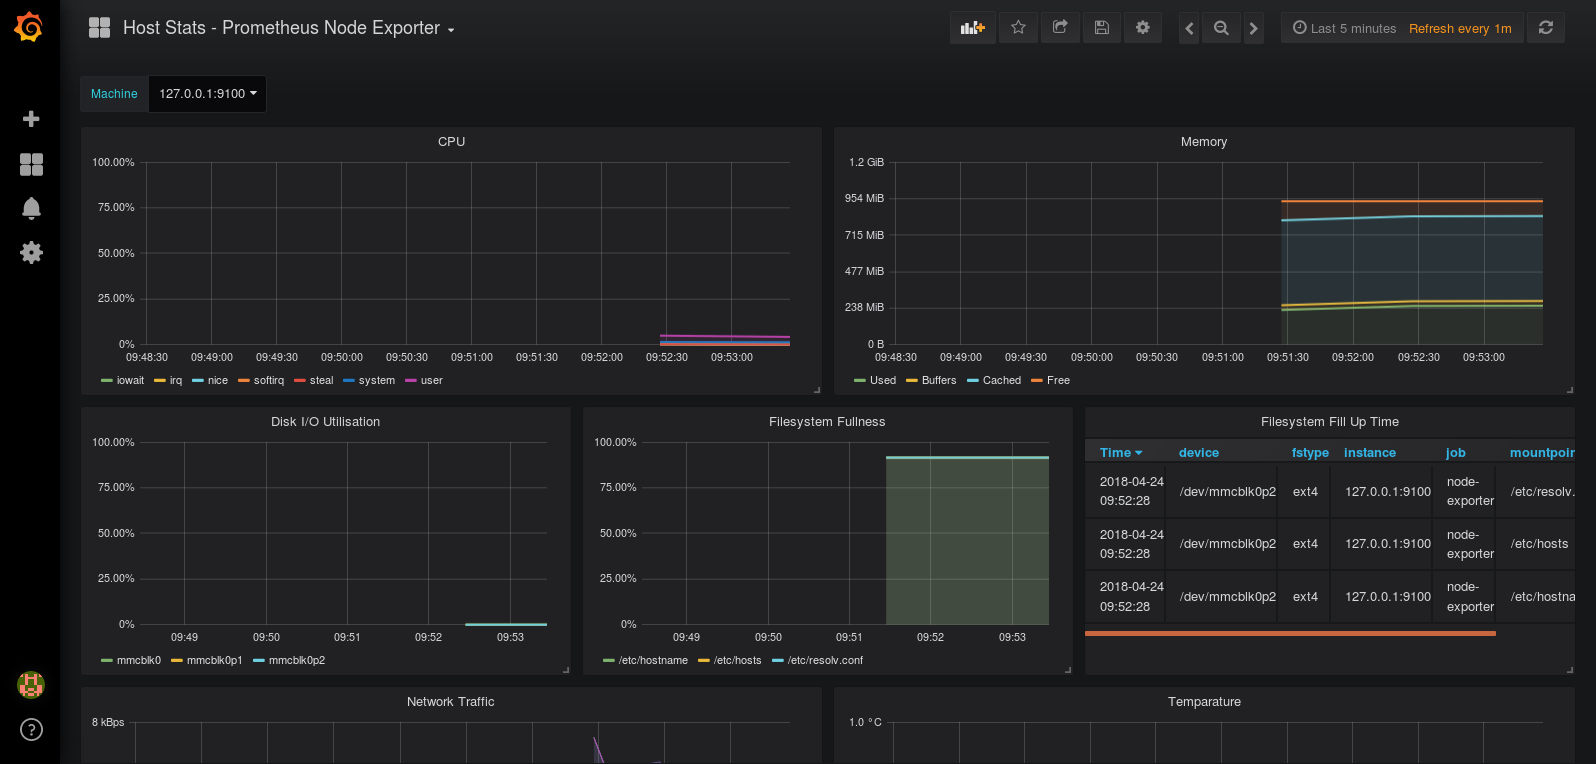
Take a look at those 3 dashboards in Grafana UI.
You should see something like:
Conclusion
Here we are at the end of the journey.
We went through a lot together: modifying archlinux kernel parameters, checking cgroup stats via lxc-checkconfig, crosscompiling Kubelet for ARM and actually running Prometheus and friends on a Raspberry Pi.
Hope you enjoyed the journey and see you next time!