Overview
- Prometheus graduated CNCF.
- Openmetrics joined the incubator stage of CNCF.
- Prometheus will offer built-in TLS and auth in HTTP endpoints, as well as implement subqueries (e.g. max_over_time(rate(foo[5m])[1h:1m]))
Leveraging Prometheus to Build, Test, and Release New Products at DigitalOcean.
Talk by Sneha Inguva from DigitalOcean Observability team.
Slides
Talks about leveraging Prometheus to build and test, showed and example setting it up on DigitalOcean’s VPC and DHCP products.
Instrumenting code using Four Golden Signals (from Google SRE book) or Brendan Gregg’s USE method, working in build -> instrument -> test -> iterate loops. They use metrics, tracing, logging.
I really liked how they have a master dashboard, which links to a smaller, service specific dashboard. It sort of makes sense, as when things break, you want to see general view of what is affected and deep down into specific service view. Also really cool dashboard names, which reiterate the pattern:
- [production] RNS Architecture – Master
- [production] RNS Architecture – Northd
- [production] RNS Architecture – RnsDB – MySQL Overview
- [production] RNS Architecture – RabbitMQ
Testing:
- easy to load test with generated GRPC client + multiple goroutines.
- chaos testing – take down a component in the system.
- integration testing
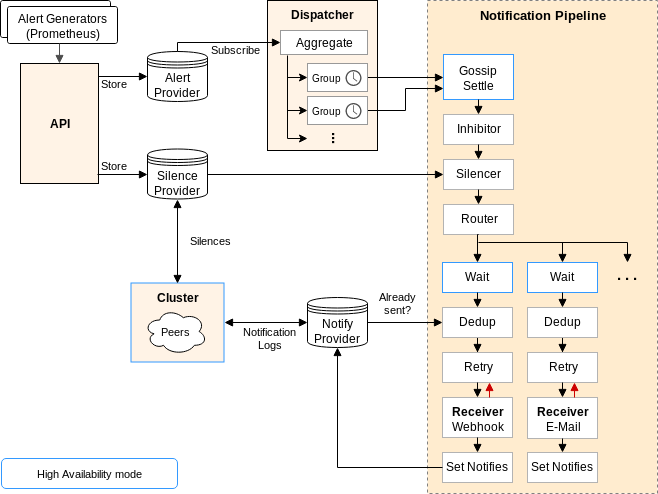
Life of an alert
Talk by Stuart Nelson from SoundCloud, maintainer of alertmanager.
[Slides]
Talk went deep dive into alertmanager and how it goes thru all the stages of alerting.
There is this interesting feature in Alertmanager called inhibit rules, which once inhibiting alert fire, it can mute other non important alerts. Imagine if datacenter is on fire and you would probably get tons of alertsm which doesn’t help you figure out what is happening, so you would write an alertmanager inhibit rule, which would mute all the non important alerts. Something like:
   inhibit_rules:
    - source_match:
        severity: 'critical'
      target_match:
        severity: 'warning'
But be careful check for no circular inhibitions and remember that silenced alert which is inhibiting alert will still mute alerts
There is alert visualizer UI, which can draw your alert tree.
Alert grouping is another interesting feature, which has a couple of options to tweak such as group_wait – how long to wait for first group of alerts to form, group_interval – how long to wait before sending a notification about new alerts that are added to a group of alerts.
In the end alert goes thru notify pipeline, which has send at least one semantics.
In clustered mode before sending alert there is a wait and dedup stage in order to avoid duplicate notification. Alertmanager instance will wait HA mode position * 15s and then checks gossiped alert notification log and if alert is not there, then send external notification. HA mode position start’s from 0, so the first instance doesn’t wait.
Q/A
Does Alertmanager store history of alerts?
There is no history of alerts in alertmanager, you can write a kafka sink for your notifications.
How to test inhibitions?
There is no other way apart from visual editor.
Alertmanager HA is still in development?
Soundcloud have been using for a couple of months, work fine.
How alert grouping works?
When new alert comes that will join the group, it will be notified after group_interval if group was already fired, if group hasn’t formed yet then after group_wait.
How do SoundCloud templates look for grouped alerts?
Sound cloud does the common labels, alert name and a link to the runbook.
You can look at the source of the alert and know how many of them are firing.
But in their slack template they actually show how many are firing.
Hidden linux metrics with ebpf_exporter
Talk by Ivan Babrou from Cloudflare.
Slides
Blogpost
You can use DNS over tls using Cloudflare, so that your internet provider doesn’t know what you are browsing 🙂
Current exporters don’t allow you to answer questions like:
How many fast io operations is disk doing?
How many slow io operations?
Current issue with node_exporter is that it doesn’t give you histograms, as Linux Kernel only provides counters in /proc/diskstats. There is a way around that using ebpf. Turns out ebpf is already in kernel, used by seccomp filters. It’s a in-kernel sandboxed virtual machine, which allows you to access kernel data and put in some memory region, after that exporter just needs to map the memory region and give you metrics out of that.
So if you need more detailed metrics from Linux definitely look into ebpf_exporter.
Prometheus Monitoring Mixins: Using Jsonnet to Package Together Dashboards, Alerts, and Exporters
Talk by Tom Wilkie from Grafana.
Slides
The talk is mostly the same as the one in KubeCon
Showed basics of jsonnet and how to template out grafana dashboards, alerts and recording rules.
There is also a jsonnet-bundler package manager to get the mixins.
Currently there are mixins for:
Ongoing:
Autoscaling All Things Kubernetes with Prometheus
Talk by Michael Hausenblas and Frederic Branczyk.
Slides
There are 2 types of autoscaling, vertical and horizontal.
Not all apps are horizontally scaleable.
Right now vertical autoscaling requires pod restart.
If you want to use Prometheus metrics for autoscaling, you need to launch:
API aggregation -> k8s-prometheus-adaptor -> Prometheus
Right now the Custom Metrics API doesn’t provide historic data, only current metrics. But sig-instrumentation & sig-autoscaling is working on that as it is needed for VerticalPodAutoScaler.
VPA is pre-alpha.
Taking Advantage of Relabeling
Talk by Julien Pivotto from Inuits.
Slides
You can get top 10 biggest cardinality metrics:
topk(
10,
count({job="JOB_NAME"}) by (__name__)
)
The talk showed really cool tricks on how you can use relabeling:
- A config will alert on https certificate issues using Blackbox exporter based from Traefik ingress controller information.
- Relabeling to spread the load of Prometheus server by droping some targets on one server and keeping on another.
- Adding default label (for example priority: P1) to alerts.
Bomb Squad: Containing the Cardinality Explosion
Talk by Cody ‘Chowny’ Boggs from FreshTracks.
Slides
Turns out Prometheus cannot handle too much cardinality.
In Prometheus cardinality is the number of discrete label/value pairs associated with a particular metric.
A simple example of metric with big cardinality is having unique request id in a label.
Bombsquad is Prometheus sidecar which looks at a cardinality number and adds relabeling rule to all Prometheus jobs to silence the metric that causes cardinality explosion.
bombsquad comes with CLI tool that let’s you view all the silences and remove them.
You can view cardinality of your Prometheus by executing:
sort_desc(label_replace( count by(__name__) ({__name__!="", __name__!="card_count"}), "metric_name", "$1", "__name__", "(.+)" ))
Speaker also promoted cool Kubernetes CLI tool for viewing logs called stern.
Thanos – Prometheus at Scale
Talk by Bartłomiej Płotka from Improbable and Fabian Reinartz from Google.
Slides
Blogpost
- Thanos is a new approach for solving Global view and Long Term Storage problems in Prometheus.
- Thanos querier and Thanos sidecar can solve the global view and HA problem.
- Thanos sidecar is run as a Prometheus sidecar, which has GRPC endpoint, called Store API.
- Thanos querier calls to all the GRPC endpoints and returns the Prometheus data.
- Instead of adding session stickiness to Prometheus HA pairs, Thanos queries has a deduplication mechnanism.
- Deduplication switches to different replica once it finds a couple of of missing scrapes
- You can solve Long Term storage, by adding S3 compatible storage.
- Thanos sidecar then uploads 2h uncompacted Prometheus blocks to S3.
- Thanos store gateway gives a Store API for blocks in S3.
- You also need to compact & downsample blocks in S3, which is done via Thanos compactor.
- You need to think about writing queries to hit downsampled data
Using the Flux Query Engine to Query Multiple Prometheus Servers
Talk by Paul Dix from Influx Data.
Slides
Influx Data is creating a new language called “flux”, which is used for data analysis, data science applications. It should be something like Pandas / R / Matlab / Spark and support loading prometheus data.
Right now flux is very very alpha.
Improving Reliability Through Engineering an Easy-to-use Prometheus-Based Monitoring and Alerting Stack: Introducing Our Reliability Toolkit
Talk by Robin van Zijll from ING bank.
Slides
Talk was about the struggles of adopting Prometheus in a bank.
Internally the team has developed a PromQL workshop, which hopefully they will open source. Also they created Model Builder, which generates thresholds for alerts.
Explore Your Prometheus Data in Grafana
Talk by David Kaltschmidt from Grafana.
Slides
Really cool features are coming to Grafana:
- Better step alignment, so you get less “jumpy” graphs on refresh.
$__range– variable, which shows selected time range, finally you can do something likego_goroutines[$__range].- Explore window is coming, where you can explore metrics with good autocompletion support and tabs. Will be released in 6.0
- Grafana is working on some kind of git integration to support dashboard changes.
- Grafana has been secretly working on log aggregation
- Support for mixins.
RPC at Google
Talk by JBD from Google
Slides
- Google works on new monitoring system called Monarch.
- Google has statz/rpcz pages in their http servers, similiar available in OpenCensus https://opencensus.io/core-concepts/z-pages/.
- Google works on OpenCensus library, which is vendor-agnostic libraries for metrics and tracing.
- Exemplar Traces a new kind of thing, which will be reported in metrics endpoint. The idea is to link latency histogram data to OpenTracing spans.
OpenMetrics – Transforming the Prometheus Exposition Format into a Global Standard
Talk By Richard Hartmann.
Slides
- Going beyond metrics, it’s about monitoring.
- We need a better official standard, as currently SNMP is the only available monitoring standard.
- Prometheus format is going to a base for OpenMetrics.
- It’s going to change a bit to enable Exemplar traces.
- Every single data point in a time series can point to one single event.
- Prometheus will ignore the stuff it doesn’t care about.
What Prometheus Means for Monitoring Vendors
Talk By Jorge Salamero Sanz from Sysdig.
[Slides]
- The cool thing about Prometheus is that vendors don’t need to re-implement all the metrics libraries and can just Prometheus as a standard way of exposing metrics.
Implementing a Cooperative Multi-Tenant Capable Prometheus
Talk By Jonas Große Sundrup.
Slides
- Talk about how to share single Prometheus server with multiple people.
- Speaker developed promauthproxy, proxy which injects user labels into config.
- The proxy uses Prometheus go packages to parse sent PromQL and add user label to Prometheus queries.
- The same approach is used for alerts and blackbox exporter config.
- Config is validated via
promtool.
Monitoring at Scale: Migrating to Prometheus at Fastly
Talk By Marcus Barczak from Fastly.
Slides
- Moving away from Ganglia + Icinga.
- They are running one HA Prometheus pair per datacenter.
- They encrypt metrics traffic via Ghost Tunnel.
- They have a custom Service Discovery and Proxy component for configuring Prometheus.
- Fastly is looking into Thanos for LTS and global view.
Automated Prometheus Benchmarking – Pushing It to Its Limits until It Breaks!
Talk By Krasi Georgiev from Red Hat and Harsh Agarwal.
Slides
- Project doc
- Source
- Speakers created automated Prometheus benchmarking during Google Summer Of Code 2018.
- It leverages Kubernetes Prow CI, creates Kubernetes environment one Prometheus instance running with your changes and one instance with master or some other branch.
- Meta Prometheus collects benchmarks and allows to view them in Grafana.
- Benchmarking can be started via comment on github PR.
- Red Hat is also working on Kiali, UI for istio.
Anatomy of a Prometheus Client Library
Talk By Brian Brazil from Robust Perception.
Slides
- To use a counter make a reference to it and then use it, don’t look it up in a global thread-safe map.
- Put metrics in different files with different metric names.
- Client libraries are done in a way that you don’t need to worry about concurrency.
- Labels need to be known in advance and set to 0.
- There are Registries, which check for duplicate metrics and Collectors, which provide Prometheus data format.