In this post, we will explore how to monitor a typical Spring Boot Web Application using Prometheus. Additionally, we will use the RED method, which allows us to monitor critical application metrics.
Interested in learning more Prometheus? Check out Monitoring Systems and Services with Prometheus, it’s awesome course that will get you up to speed.
The RED Method
Like the Four Golden signals from Google’s SRE book, The RED Method defines the three key metrics you should measure for every microservice in your architecture. Those metrics are:
- Request Rate – the number of requests per second your application is serving.
- Error Rate – the number of failed requests per second. For web applications, it’s the responses that result in a 5xx HTTP status code.
- Duration – the whole distribution of how long it took to send the response.
Spring Boot Metrics
Let’s start with a Hello World project from the “Building a RESTful Web Service” guide. If you are new to the Spring Boot ecosystem, I advise you to complete the tutorial. If not, you can download the completed tutorial from GitHub.
Once you finish the tutorial, you will have a simple RESTFUL Web Service, which you can call using:
curl http://localhost:8080/greetingand it responds with:
{"id":1,"content":"Hello, World!"}Now to add metrics to this application, we will need to add a couple of new dependencies. We will need the Spring Boot Actuator and Micrometer. Actuator gives you some tools to make your applications production-ready, and Micrometer is the underlying library to expose metrics.
You can add them via Gradle by:
dependencies {
	implementation 'org.springframework.boot:spring-boot-starter-actuator'
        implementation 'io.micrometer:micrometer-registry-prometheus'
}
Similarly, you can do this via Maven:
<dependency>
    <groupId>org.springframework.boot</groupId>
    <artifactId>spring-boot-starter-actuator</artifactId>
</dependency>
<dependency>
    <groupId>io.micrometer</groupId>
    <artifactId>micrometer-registry-prometheus</artifactId>
</dependency>
After you add the libraries, you need to enable metrics. To do this, add a file in src/main/resources/application.properties and this following configuration:
management.endpoints.web.exposure.include=prometheus
management.metrics.distribution.percentiles-histogram.http.server.requests=true
The first line enables Prometheus endpoint, which will be available at http://localhost:8080/actuator/prometheus. The next line, which many people don’t know about, makes the Micrometer library to produce a full Prometheus Histogram.
Prometheus Histograms for Latency
By default, Spring Boot only gives you counters like the number of requests received, the cumulative time spent, and maximum duration. From maximum latency, you know what the worst outliers are. You could compute average latency from cumulative duration and request count. But as applications typically have non-normal latency distributions, averages are useless. That’s why the RED method states that you need the whole distribution. For example, imagine you have this histogram:
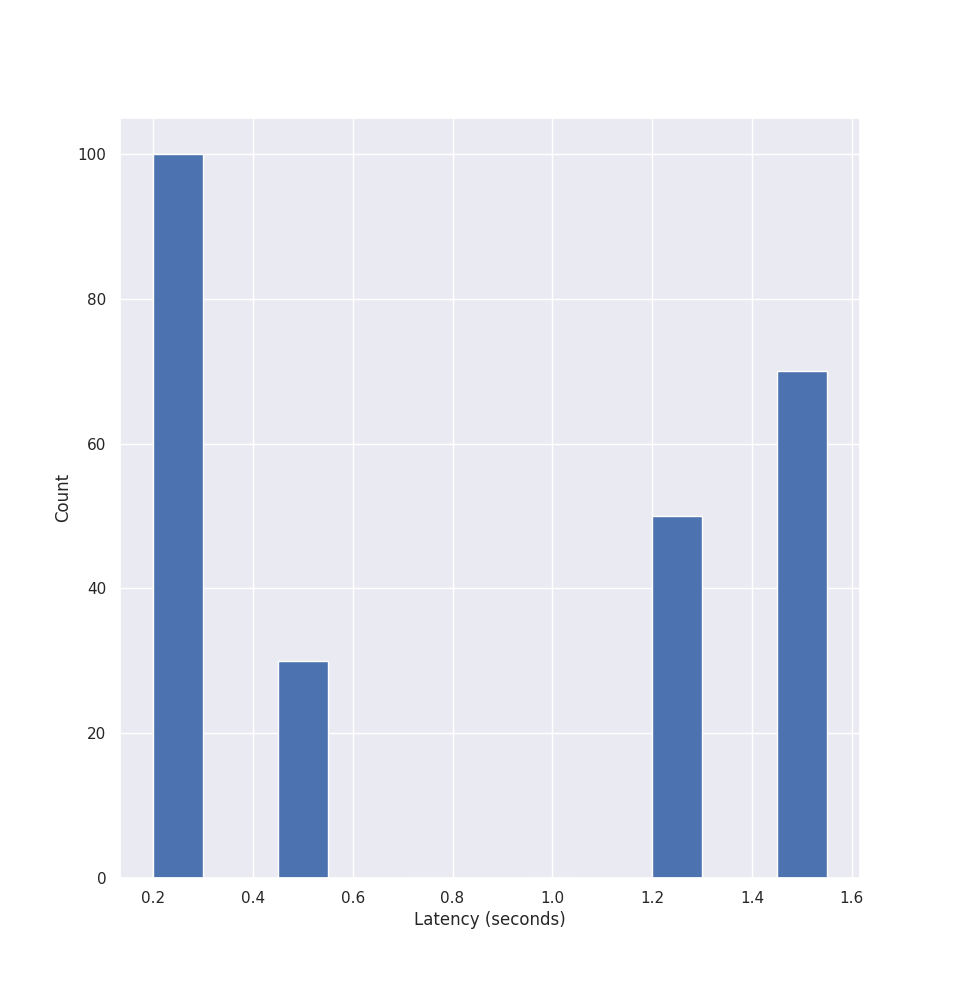
The average latency is somewhere in the middle, and as you can see, it actually never happens. And this is what happens with software. As typically low latencies happen when the application gets cache hits, data is served from memory, etc. In the worst cases, the application has a cache miss or gets the data from disk instead of memory and so the latency is way higher.
Once you enable management.metrics.distribution.percentiles-histogram.http.server.requests=true, you will start seeing the full Prometheus histogram. You can draw it using Grafana’s heatmap functionality or compute the percentiles. If you are running more than one application replica, you can aggregate applications and see the full picture.
Prometheus, Alerts & Grafana Dashboards
Now you need to make sure your Prometheus starts collecting the data. One simple example is setup a scrape config like:
scrape_configs:
  - job_name: 'greeting_application'
    metrics_path: '/actuator/prometheus'
    scrape_interval: 60
    static_configs:
      - targets: ['localhost:8080']
Once we store the metrics in Prometheus, we can alert on them and graph them in Grafana.
Here are example alerts you could use:
sum(rate(http_server_requests_seconds_count{app="springboot", status=~"5.."}[5m])) > 0

histogram_quantile(0.9, sum by (le) (rate(http_server_requests_seconds_bucket{app="springboot"}[5m]))) > 2
and here is how your Grafana dashboard could look like:

After completing this guide, you can see how to use the RED method with Spring Boot applications. In this example, the Grafana dashboard allows you to quickly see your application’s Request Rate per second, Error Rate per second, and the full Latency distribution. Which are the critical metrics for any web-based application.