Overview
I was playing around with my home Kubernetes cluster and decided to try out Node Local DNS Cache. It’s a really cool piece of software, that helps with DNS load by caching most of responses on the node local DNS and solves Linux conntrack races, which cause intermittent delays of 5s for some DNS requests. You can read more about the contrack issue in DNS intermittent delays of 5s issue & racy conntrack and dns lookup timeouts.
I definitely recommend going thru Node Local DNS cache setup, if you are interested in Kubernetes internals. Especially, If you are studying for Certified Kubernetes Administrator certification, or you are involved in Kuberenetes operations.
First, let’s take a look at how typically DNS works in Kubernetes. By default, Pods in Kubernetes send requests to a kube-dns service. Internally this is done by setting pod’s /etc/resolv.conf nameserver field to kube-dns Service IP (10.96.0.10 by default). kube-proxy manages those Service IPs and translates them to a kube-dns endpoint via iptables or IPVS technologies. With Node Local DNS Cache, pods reach out to the new Node Local DNS Cache, without any connection tracking. If the request is in the pod’s cache, good we can return response directly. Otherwise, Node Local DNS Cache reaches out to kube-dns with TCP requests, thus avoiding conntrack bug.
You can read more about Node Local DNS in Node Local DNS cache and Graduate NodeLocal DNSCache to beta Kubernetes enhancement proposals. Let’s take a look at how to deploy it.
Deployment
I recommend that you go thru Using NodeLocal DNSCache in Kubernetes clusters page and take a look at generated manifests.
In order to deploy Node Local DNS, you will have to select link local IP address. Link local IP addresses are a special class of IP addresses in the range of 169.254.0.1 to 169.254.255.254. Importantly, routers do not forward packets with link local addresses, as there is no guarantees that this range is unique beyond it’s network segment. The example deployment uses 169.254.20.10 as a default local link adress.
Deep Dive
Let’s go deeper in how Node Local DNS works. You can find the code in https://github.com/kubernetes/dns repository in cmd/node-cache directory. Node Local DNS uses CoreDNS under the hood, with some additional functionality for setting up networking, templating configs & reloading. In this section, I will go thru details step by step. I’ll assume that you are running kube-proxy in iptables mode, kube-dns Cluster IP is 10.96.0.10 and you have chosen 169.254.20.10 as a link local IP.
Networking
Firstly, Node Local DNS creates a network interface. It executes these Linux commands:
ip link add nodelocaldns
ip addr add 169.254.20.10 dev nodelocaldns
ip addr add 10.96.0.10 dev nodelocaldns
I believe this is needed to make the pod listen on those IPs, as it’s configured with hostNetwork: true. You can see the network interface by issuing ip addr on the node and looking for a link named nodelocaldns. It should give an output similar to this:
128: nodelocaldns: mtu 1500 qdisc noop state DOWN group default
link/ether 46:e7:18:86:15:23 brd ff:ff:ff:ff:ff:ff
inet 169.254.20.10/32 brd 169.254.20.10 scope global nodelocaldns
valid_lft forever preferred_lft forever
inet 10.96.0.10/32 brd 10.96.0.10 scope global nodelocaldns
valid_lft forever preferred_lft forever
Secondly, Node Local DNS will sync iptables rules. You can see those rules by executing iptables-save, look for 10.96.0.10/169.254.20.10 IP related rules. This is what I see on one of my nodes:
*raw

-A PREROUTING -d 10.96.0.10/32 -p udp -m udp --dport 53 -j NOTRACK
-A PREROUTING -d 10.96.0.10/32 -p tcp -m tcp --dport 53 -j NOTRACK
-A PREROUTING -d 169.254.20.10/32 -p udp -m udp --dport 53 -j NOTRACK                                                                   -A PREROUTING -d 169.254.20.10/32 -p tcp -m tcp --dport 53 -j NOTRACK
-A OUTPUT -s 10.96.0.10/32 -p tcp -m tcp --sport 8080 -j NOTRACK
-A OUTPUT -d 10.96.0.10/32 -p tcp -m tcp --dport 8080 -j NOTRACK                                                                        -A OUTPUT -d 10.96.0.10/32 -p udp -m udp --dport 53 -j NOTRACK
-A OUTPUT -d 10.96.0.10/32 -p tcp -m tcp --dport 53 -j NOTRACK
-A OUTPUT -s 10.96.0.10/32 -p udp -m udp --sport 53 -j NOTRACK
-A OUTPUT -s 10.96.0.10/32 -p tcp -m tcp --sport 53 -j NOTRACK
-A OUTPUT -s 169.254.20.10/32 -p tcp -m tcp --sport 8080 -j NOTRACK
-A OUTPUT -d 169.254.20.10/32 -p tcp -m tcp --dport 8080 -j NOTRACK                                                                     -A OUTPUT -d 169.254.20.10/32 -p udp -m udp --dport 53 -j NOTRACK
-A OUTPUT -d 169.254.20.10/32 -p tcp -m tcp --dport 53 -j NOTRACK
-A OUTPUT -s 169.254.20.10/32 -p udp -m udp --sport 53 -j NOTRACK
-A OUTPUT -s 169.254.20.10/32 -p tcp -m tcp --sport 53 -j NOTRACK
...
*filter
...
-A INPUT -d 10.96.0.10/32 -p udp -m udp --dport 53 -j ACCEPT
-A INPUT -d 10.96.0.10/32 -p tcp -m tcp --dport 53 -j ACCEPT
-A INPUT -d 169.254.20.10/32 -p udp -m udp --dport 53 -j ACCEPT
-A INPUT -d 169.254.20.10/32 -p tcp -m tcp --dport 53 -j ACCEPT
...
-A OUTPUT -s 10.96.0.10/32 -p udp -m udp --sport 53 -j ACCEPT
-A OUTPUT -s 10.96.0.10/32 -p tcp -m tcp --sport 53 -j ACCEPT
-A OUTPUT -s 169.254.20.10/32 -p udp -m udp --sport 53 -j ACCEPT
-A OUTPUT -s 169.254.20.10/32 -p tcp -m tcp --sport 53 -j ACCEPT
Node Local DNS adds these rules right before any kube-proxy rules, so that they are evaluated first. -j NOTRACK makes TCP & UDP packets sent to the local or kube-dns IP address to be untracked by conntrack. This is how Node Local DNS cache avoids conntrack bug and takes over the packets to send to kube-dns IP.
That’s all from the networking configuration. Now let’s move on to CoreDNS configuration.
CoreDNS configuration
The deployments adds node-local-dns configmap. This config map is in Corefile format (except for special variables), which is a config format for CoreDNS. I really like the simplicity and readability of this format. This is how my deployment’s Corefile looks:
    cluster.local:53 {
        errors
        cache {
                success 9984 30
                denial 9984 5
        }
        reload
        loop
        bind 169.254.20.10 10.96.0.10
        forward . __PILLAR__CLUSTER__DNS__ {
                force_tcp
        }
        prometheus :9253
        health 169.254.20.10:8080
        }
    in-addr.arpa:53 {
        errors
        cache 30
        reload
        loop
        bind 169.254.20.10 10.96.0.10
        forward . __PILLAR__CLUSTER__DNS__ {
                force_tcp
        }
        prometheus :9253
        }
    ip6.arpa:53 {
        errors
        cache 30
        reload
        loop
        bind 169.254.20.10 10.96.0.10
        forward . __PILLAR__CLUSTER__DNS__ {
                force_tcp
        }
        prometheus :9253
        }
    .:53 {
        errors
        cache 30
        reload
        loop
        bind 169.254.20.10 10.96.0.10
        forward . __PILLAR__UPSTREAM__SERVERS__ {
                force_tcp
        }
        prometheus :9253
        }
The important bit in this configuration is the cluster.local zone, which handles all Kubernetes cluster local DNS names. In this zone you can see that we configured caching, with 9984 record limit and 30/5 seconds time to live. If request is isn’t in the cache, it will use TCP (which avoids conntrack bug) to send the request to __PILLAR__CLUSTER__DNS.
This creates an interesting problem, how do we send DNS traffic to kube-dns? We can’t use it’s IP as the traffic will go to Node Local DNS pod itself due to networking changes it did. The way Node Local DNS solves this is it adds new Service for existing kube-dns deployment. This is how the service looks:
apiVersion: v1
kind: Service
metadata:
  name: kube-dns-upstream
  namespace: kube-system
  labels:
    k8s-app: kube-dns
    kubernetes.io/cluster-service: "true"
    addonmanager.kubernetes.io/mode: Reconcile
    kubernetes.io/name: "KubeDNSUpstream"
spec:
  ports:
  - name: dns
    port: 53
    protocol: UDP
    targetPort: 53
  - name: dns-tcp
    port: 53
    protocol: TCP
    targetPort: 53
  selector:
    k8s-app: kube-dns
This service creates a new Cluster IP, which can be used to contact kube-dns pod and skip Node Local DNS iptables rules. The __PILLAR__CLUSTER__DNS is a special template variable, which Node Local DNS will template out. This is done by parsing KUBE_DNS_UPSTREAM_SERVICE_HOST environment variable, which is generated on pod startup if enableServiceLinks is enabled (by default it is). Keep in mind, if you recreate the service, you will have to restart the Node Local DNS pods.
In CoreDNS config, we also have .:53 zone, which handles the case if resolution request isn’t for service running inside Kubernetes. We cache the request and forward to __PILLAR__UPSTREAM__SERVERS upstream DNS server. Node Local DNS looks up __PILLAR__UPSTREAM__SERVERS value from kube-dns configmap. The example deployment doesn’t have it set, so it defaults to /etc/resolv.conf. Note that Node Local DNS uses dnsPolicy: Default, which makes /etc/resolv.conf to be same as what is on the node.
That is it for the deep dive. Now let’s take a look operations side of things.
Operations
In this section, let’s take a look at high availability & monitoring setup. Currently Node Local DNS has a limited high availability setting. Let’s take a look.
High Availability
The availability of this setup currently depends on Node Local DNS agent signal handling. During regular pod termination, the pod will remove dummy interface & iptables rules. This switches traffic from itself to a regular kube-dns pod running in the cluster. But if we forcefully kill the pod, removal of iptable rules won’t happen. This then breaks all the DNS traffic for that particular node, as nothing is listening on nodelocaldns interface.
To avoid unnecessary trouble, the default DaemonSet doesn’t have Memory/CPU limits set. I suggest that you leave it that way, to avoid out of memory terminations or any CPU throttling. Additionally the pods are marked with system-node-critical priority, which makes them almost guaranteed to be scheduled first and less likely to be evicted, when the node is out of resources.
If you want to be on the safe side, I recommend that you change DaemonSet update strategy to OnDelete and do maintenance/upgrade by draining Kubernetes nodes and deleting Node Local DNS pods one by one after the successful drain. It’s really easy to automate it.
Monitoring
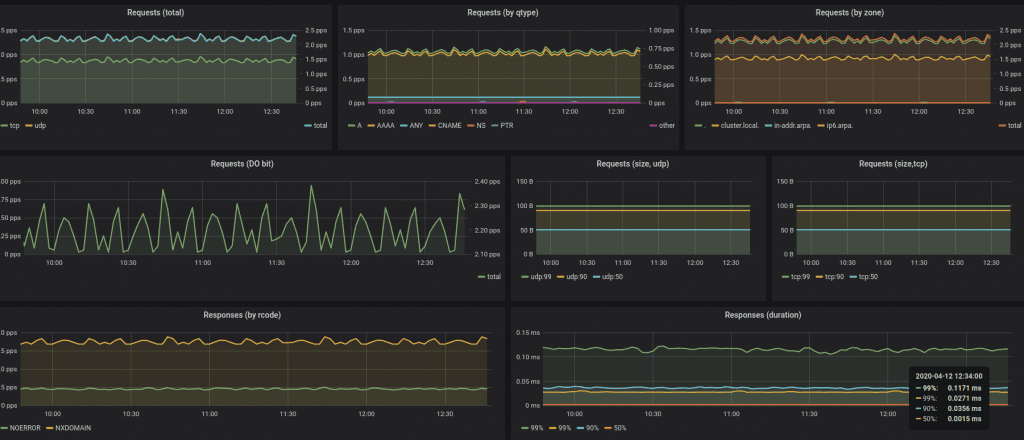
It’s also important to have good monitoring in place. If you are running Prometheus or a monitoring system which supports Prometheus metrics format, I highly recommend you to scrape metrics on 9253 and 9353 ports. 9253 port has regular CoreDNS metrics, which contain the usual RED metrics: queries, durations & error counts. 9353 port has a coredns_nodecache_setup_errors/coredns_nodecache_setup_errors_total metric, which increases when there are errors syncing IP table rules or setting up/reloading configuration.
Additionally, I have built a Node Local DNS mixin, which has Prometheus Alerts. You can get them via jb install github.com/povilasv/nodelocaldns-mixin if you are using jsonnet to generate your Prometheus alerts. If not, you can grab an example from here, and tinker it for your Kubernetes/Prometheus setup. I plan to add CoreDNS dashboard and SLA / Error budget alerts, so stay tuned 🙂
Another good way to do monitoring, is adding black-box monitoring into the mix. One simple thing you can do is constantly send a DNS request and expect a timely response. Node Problem Detector can implement this. You can find an example Node Problem Detector plugin in this uSwitch’s open source repository.
Conclusion
That’s it. Hopefully by now you now how Node Local DNS magic works and you can deploy it and operate it reliably. Please keep in mind that Node Local DNS is currently in Beta.
Have some free time? Consider applying for Certified Kubernetes Administrator certification. I am a Certified Kubernetes Administrator myself and I think it’s worth it, you will learn a lot of Kubernetes & become kubectl ninja.
Thanks for reading, hope you enjoyed it & see you next time!