This is a complete guide to Kubernetes API Server SLO Alerts.
In this new guide, you’ll learn:
- Kubernetes official Service Level Objectives (SLOs).
- What are Error Budgets?
- How to turn Error Budgets into alerts?
- What are Multiwindow, Multi-Burn-Rate alerts?
- What is this KubeAPIErrorBudget alert?
- Mixin’s Kubernetes API Server SLO alerts.
- Lots more.
Kubernetes Service Level Objectives
Kubernetes has a couple of scalability and performance Service Level Objectives (SLO) described in the Kubernetes scalability and performance SLIs/SLOs document. These SLOs, set an expectation of how much uptime the Kubernetes control-plane services should have. The current official SLOs for Kubernetes are:
| SLI | SLO | Details |
|---|---|---|
| Latency of mutating API calls for single objects for every (resource, verb) pair, measured as 99th percentile over last 5 minutes | In default Kubernetes installation, for every (resource, verb) pair, excluding virtual and aggregated resources and Custom Resource Definitions, 99th percentile per cluster-day <= 1s | Details |
| Latency of non-streaming read-only API calls for every (resource, scope) pair, measured as 99th percentile over last 5 minutes | In default Kubernetes installation, for every (resource, scope) pair, excluding virtual and aggregated resources and Custom Resource Definitions, 99th percentile per cluster-day (a) <= 1s if scope=resource (b) <= 30s otherwise (if scope=namespace or scope=cluster) | Details |
| Startup latency of schedulable stateless pods, excluding time to pull images and run init containers, measured from pod creation timestamp to when all its containers are reported as started and observed via watch, measured as 99th percentile over last 5 minutes | In default Kubernetes installation, 99th percentile per cluster-day <= 5s | Details |
So a well-behaved Kubernetes cluster should meet all the performance requirements in these official SLOs.
Error Budgets
Sometimes it’s more convenient to think about Error Budgets, rather than SLOs, as they tell you how many failures you can withstand. Computing the Error Budget is simple, subtract the SLO from 100%. So, if your service’s SLO is to serve 99.99% of all requests successfully, then the Error Budget is a failure rate of 0.01.
You can use the Error Budgets to guide your maintenance work. For example, if you have plenty of Errors Budget, you can aggressively roll out updates. But if you are almost out of it, you should work on stabilizing your systen.
Once you start keeping track of your Error Budgets, you want to get alerts when you are close to depleting your budget.
How do you turn your Error Budget into alerts?
Google SREs recommend Multi Window, Multi Burn Rate alerts to turn the Error Budget into actionable alerts. Let’s unpack this.
Firstly, if you use Error Budgets, you care about how much of the budget is left and how fast you burn it. So Google SRE Workbook authors coined a term called Burn Rate.
Burn rate quantifies the speed of Error Budget burn and is relative to your SLO time window. For example, a burn rate of 1 consumes your Error Budget at a rate that leaves you with exactly 0 budget at the end of your SLO’s time window. Likewise, a burn rate of 2 consumes all your Error Budget in half your SLO’s time window.
You can use the Burn Rate to create alerts. If you are quickly burning through your Error Budget, you should probably get an alert before running out of the budget. Let’s say your SLO is to serve 99.99% of all requests successfully in the last 30 days, and a 5% error budget burn over the last hour is significant enough to throw an alert.
SRE Workbook provides the following formula to compute the Error Budget consumed by the time the alert fires:
![\[burn rate \times alerting window size \over period\]](https://povilasv.me/wp-content/ql-cache/quicklatex.com-90594a62b37c3a24703cd7c58369feed_l3.png "Rendered by QuickLaTeX.com")
Substituting values from our examples makes it:
![\[{burn rate \times 1h \over 30 days} = 0.05\]](https://povilasv.me/wp-content/ql-cache/quicklatex.com-02bc6cbc0be684c39dab38173b252bba_l3.png "Rendered by QuickLaTeX.com")
![\[{burn rate \times 1h} = 0.05 \times 30 \times 24h\]](https://povilasv.me/wp-content/ql-cache/quicklatex.com-499c4a7b64e28bef1f04b54f72cd84f1_l3.png "Rendered by QuickLaTeX.com")
![\[burn rate = 36 \]](https://povilasv.me/wp-content/ql-cache/quicklatex.com-32ad1eb76541914f6c28e83a951e7944_l3.png "Rendered by QuickLaTeX.com")
So a 5% of a 30-day error budget spent over one hour requires a Burn Rate of 36.
Now you can use this Burn Rate to create a Prometheus alert. Firstly, you create a recording rule that counts the error rate over the last hour:
record: apiserver_request:burnrate1h
expr:
  sum(rate(apiserver_request_total{job="kube-apiserver", code=~"5.."}[1h]))
    /
  sum(rate(apiserver_request_total{job="kube-apiserver"}[1h]))
Secondly, you use the Burn Rate from the example above in the Prometheus alert:
- alert: HighErrorRate
  expr: apiserver_request:burnrate1h > 36 * 0.001
So this is how you construct Burn Rate alerts.
Though they still have problems. What if you burn your error budget at a 4% burn rate over the last hour? In this case, no alert will fire, but you will be out of the error budget in 25 hours.
Multiple burn rate alerts
For this reason, Google SREs recommend setting multiple burn rate alerts with different time windows and burn rate values. Usually, you have a couple of fast burn rate alerts and a few slow burn rate alerts.
Fast burn rate alerts warn you about a sudden, significant change in errors. You want the fast burn rate alert to fire quickly and notify you immediately so you can resolve the problem as soon as possible. These alerts typically use a shorter lookback period.
While slow burn rate alerts warn you about a slow error rate, that threatens to exhaust your error budget before the end of the SLO time window. These alerts use longer lookback periods and typically create a ticket for you to investigate later.
SRE workbook has some recommended values for a 99.9% SLO:
| Budget Consumption | Time window | Burn rate | Notification |
|---|---|---|---|
| 2% | 1 hour | 14.4 | page |
| 5% | 6 hours | 6 | page |
| 10% | 3 days | 1 | ticket |
And this is how you can write it in the Prometheus alerting rules:
expr: (
  apiserver_request:burnrate1h > (14.4*0.001)
    or
  apiserver_request:burnrate6h > (6*0.001)
)
severity: critical

expr: apiserver_request:burnrate3d > 0.001
severity: warning
Multiwindow, Multi-Burn-Rate Alerts
One issue with Multiple Burn Rate alerts is the alert reset time. The alert wouldn’t clear for a while if you got a brief outage due to long lookback periods. Let’s say you have a brief complete outage, and the slow burn rate alert starts firing. You will need to wait for the whole lookback period for the alert to clear, which can take days.
In order to solve the alert reset time problem, the SRE workbook recommends adding a shorter lookback window that checks if the error rate is still happening. For example:
expr: (
  apiserver_request:burnrate1h > (14.4*0.001)
    and
  apiserver_request:burnrate5m > (14.4*0.001)
)
This alert will close itself after 5 minutes when the error condition is fixed, rather than 1 hour later.
Kubernetes Multiwindow, Multi-Burn-Rate API Server Alerts
In the Kubernetes Mixin, maintainer Matthias, added Multi Window, Multi Burn Rate Alerts for API Server. These alerts borrow ideas from the official Kubernetes SLOs but do not implement the official SLOs. Out of the box, it includes four Error Budget alerts named KubeAPIErrorBudget. They use a rolling 30 days SLO window with 99% of availability. The following table describes the four alerts:
| Budget Consumption | Time window | Burn rate | Severity |
|---|---|---|---|
| 2% | 1 hour | 14.4 | critical |
| 5% | 6 hours | 6 | critical |
| 10% | 1 day | 3 | warning |
| 10% | 3 days | 1 | warning |
The Error Rate is computed by counting slow requests and responses that return a 5xx error code. Like official API Server SLOs, read and write request errors are computed differently. The following table summarizes the Kubernetes SLO error thresholds:
| Request Type | Condition |
|---|---|
| Write (POST | PUT |
| Write (POST | PUT |
| Read (LIST | GET methods) |
| Read (LIST | GET methods) scope=resource |
| Read (LIST | GET methods) scope=namespace |
| Read scope=cluster | slower than 5s |
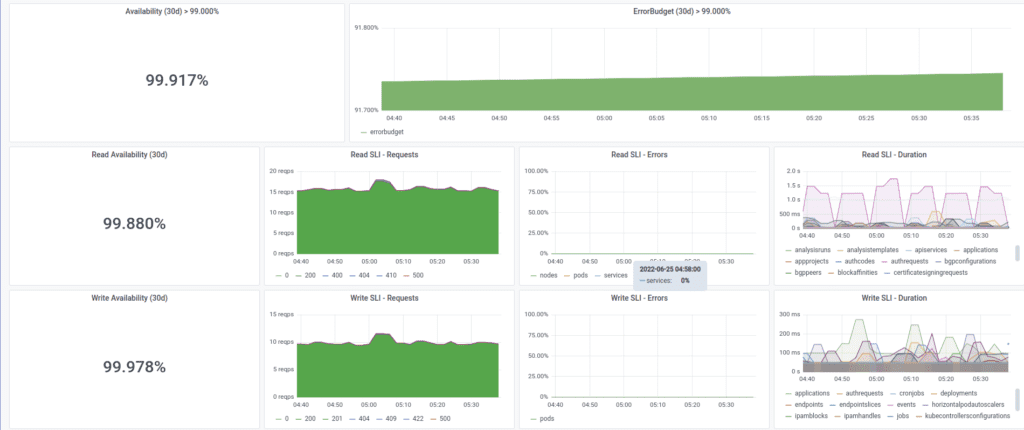
It is essential to understand the table above if you are using these alerts. Because Error Budget alerts don’t help you identify the problem with the application. For example, the API server might respond too slowly or return 5xx responses, and the alerts won’t differentiate between the two. To identify the actual problem, you should look at the Kubernetes API Server Grafana dashboard or search for the problems using PromQL. For using PromQL, take a look at The Prometheus Operator KubeAPIErrorBudgetBurn runbook.
Kubernetes Mixin Prometheus Alerts and Recording Rules
Kubernetes Mixin generates Prometheus alerts and recording rules for each lookback window. These rules follow a similar pattern as the examples in the previous paragraphs. Let’s take a look at a single fast burn-rate alert:
- name: kube-apiserver-slos
  rules:
  - alert: KubeAPIErrorBudgetBurn
    annotations:
      description: The API server is burning too much error budget.
      summary: The API server is burning too much error budget.
    expr: |
      sum(apiserver_request:burnrate1h) > (14.40 * 0.01000)
        and
      sum(apiserver_request:burnrate5m) > (14.40 * 0.01000)
    for: 2m
    labels:
      long: 1h
      severity: critical
      short: 5m
In this case, you get an alert if you are burning about 2% of your Error Budget in the last hour, and the alert closes after about 5 minutes when the error condition goes away.
The actual error computations are in the apiserver_request:burnrate5m Prometheus Recording rules. There are two apiserver_request:burnrate5m recording rules – one for “read” requests and one for “write” requests. The following example shows a Prometheus Recording rule that computes the burn rate for write requests with a 1-hour lookback window:
record: apiserver_request:burnrate1h
labels:
  verb: write
  expr: |
    (
      (
      # too slow
      sum(rate(apiserver_request_duration_seconds_count{job="kube-apiserver",verb=~"POST|PUT|PATCH|DELETE"}[1h]))
        -
      sum(rate(apiserver_request_duration_seconds_bucket{job="kube-apiserver",verb=~"POST|PUT|PATCH|DELETE",le="1"}[1h]))
      )
      +
      sum(rate(apiserver_request_total{job="kube-apiserver",verb=~"POST|PUT|PATCH|DELETE",code=~"5.."}[1h]))
    )
  /
sum(rate(apiserver_request_total{job="kube-apiserver",verb=~"POST|PUT|PATCH|DELETE"}[1h]))
To find the slow requests, Kubernetes Mixin uses the fact that Prometheus histograms are cumulative, which means that you can subtract the cumulative bucket from the total requests to find the slow requests. For example, you have the following histogram:
apiserver_request_duration_seconds_bucket{le="0.1", resource="deployments", verb="PUT"} 6
apiserver_request_duration_seconds_bucket{le="0.2", resource="deployments", verb="PUT"} 9
apiserver_request_duration_seconds_bucket{le="0.4", resource="deployments", verb="PUT"} 16
apiserver_request_duration_seconds_bucket{le="1", resource="deployments", verb="PUT"} 18
The le="0.1" bucket tells you that 6 requests took less than or equal to 100ms. It is because each bucket stores the request count that is less than or equal to the bucket value. So to compute the number of requests that are slower than 1 second, you can subtract the “less than or equal 1s” bucket from the total requests:
apiserver_request_duration_seconds_count
 -
apiserver_request_duration_seconds_bucket{le="1"}
So this is how you find the slow requests. Now you also want to add 5xx responses into the account, so the formula becomes:
# slow requests
(
apiserver_request_duration_seconds_count
  -
apiserver_request_duration_seconds_bucket{le="1"}
)
# errors
+
apiserver_request_total{code="5xx"}
Note: if you have a slow error, it will burn your budget twice!
Lastly, to make this follow the SLO format, you need to compute the ratio of failed requests to the total requests, so the formula becomes:
(
# slow
  (
  apiserver_request_duration_seconds_count
  -
  apiserver_request_duration_seconds_bucket{le="1"}
  )
  # errors
  +
  apiserver_request_duration_seconds_count{code="5xx"}
)
  /
apiserver_request_total
If you ignore all the aggregations, you can see a similar formula in the generated Kubernetes Mixin recording rule.
Kubernetes Mixin configuration
Kubernetes Mixin allows you to configure API Server SLO Alerts. To learn more, take a look at the config.libsonnet configuration file:
SLOs: {
  apiserver: {
    days: 30, // The number of days we alert on burning too much error budget for.
    target: 0.99, // The target percentage of availability between 0-1. (0.99 = 99%, 0.999 = 99.9%)
    // Only change these windows when you really understand multi burn rate errors.
    // Even though you can change the days above (which will change availability calculations)
    // these windows will alert on a 30 days sliding window. We're looking into basing these windows on the given days too.
    windows: [
      { severity: 'critical', 'for': '2m', long: '1h', short: '5m', factor: 14.4 },
      { severity: 'critical', 'for': '15m', long: '6h', short: '30m', factor: 6 },
      { severity: 'warning', 'for': '1h', long: '1d', short: '2h', factor: 3 },
      { severity: 'warning', 'for': '3h', long: '3d', short: '6h', factor: 1 },
    ],
  },
},
You can also change the latency targets with the variables defined in the kube_apiserver.libsonnet file. But don’t forget to check whether the actual bucket exists in the metrics.