Introduction
Kubelet is a Node daemon that registers itself with the Kubernetes API Server and manages Pods for that Node. It’s important to know that, Kubelet works in terms of Pods rather than Deployments or Containers. It watches the Pods assigned to it and ensures they are healthy and running. There are many things Kubelet needs to do to manage and run Pods, such as:
- pull container images and run container processes
- create and assign a network interface to the Pod
- create and update Linux Control Groups (cgroups)
- mount all the necessary volumes and Kubernetes secrets
- handle and rotate container logs
- periodically check Pods readiness and healthiness probes
- gather metrics about containers
- kill the containers which go above their memory limit
- restart the failing containers
- periodically check the current Pod state
Although Kubelet is a monolith, it doesn’t do everything by itself. Instead, it delegates tasks to other services.
Firstly, Kubelet delegates container management to container runtimes such as containerd or CRI-O. Runtimes implement a standard Container Runtime Interface (CRI), which Kubelet calls via its gRPC client. Thus container runtime handles all low-level details of pulling container images and spinning up and stopping containers.
Secondly, Kubelet delegates storage operations to Container Storage Interface (CSI) drivers, like ceph-csi, or Google persistent disk driver. CSI is also a gRPC interface, which exposes storage management functions such as:
- creating and deleting volumes
- mounting and unmounting volumes
- gathering stats
- retrieving volume capabilities
- expanding volumes
- cloning volumes
Thirdly, Kubelet delegates the programming of Pod networking to add-ons such as Calico or Weave Net. Add-ons must implement the Container Network Interface (CNI), a custom protocol based on the execution of binaries.
In addition to managing Pods, Kubelet manages the Node, its capacity, and resources. It does things such as:
- reports Node status, things like: out of memory, and disk pressure
- periodically sends health checks to Kubernetes API Server
- reports capacity metrics.
- periodically removes dead containers and old container images
- enforces adequate resources by evicting pods
Operational considerations

Kubelet’s main job is to synchronize Nodes Pod’s desired configuration with the currently running Pods in the Node. Kubelet periodically runs a synchronization loop that reads desired state configuration and matches the state with events from the Pod Lifecycle Event Generator (PLEG). The desired state can come from the following:
- API Server. Kubelet is watching the Pods with Kubelet’s Node name.
- Files. Kubelet is watching the Pod YAML files typically located in /etc/kubernetes/manifests.
- HTTP Client. Kubelet periodically calls an HTTP Server, which returns a list of Pods.
Then the PLEG periodically lists all containers currently running on the Node via CRI and generates ContainerStarted, ContainerDied, ContainerRemoved, and ContainerChanged events. Finally, based on these events and the desired state, Kubelet dispatches a command to a particular Pod Worker, which runs asynchronously.
The Pod Worker manages a single Pod and executes actions, such as removing and updating a Pod by interacting with the Container Runtime and other subsystems.
How to monitor Kubelet
Kubelet’s main job is to run Pods. Although it’s a control loop service, you can use a method similar to RED to monitor critical metrics. So the critical metrics are:
- Latency – How long does it take to run a Pod?
- Errors – How many Pod run errors occur?
- Operations – How many Pod runs per second?
Kubelet Service Level Objectives
Kubernetes Service Level Objectives (SLO) provide one official Kubelet-related SLI & SLO. The Service Level Objective for Pod Startup Latency defines the following Service Level Indicator:
Startup latency of schedulable stateless pods, excluding time to pull images and run init containers, measured from pod creation timestamp to when all its containers are reported as started and observed via watch, measured as 99th percentile over last 5 minutes
And the following Service Level Objective:
In default Kubernetes installation, 99th percentile per cluster-day <= 5s
Kubernetes Monitoring Mixin

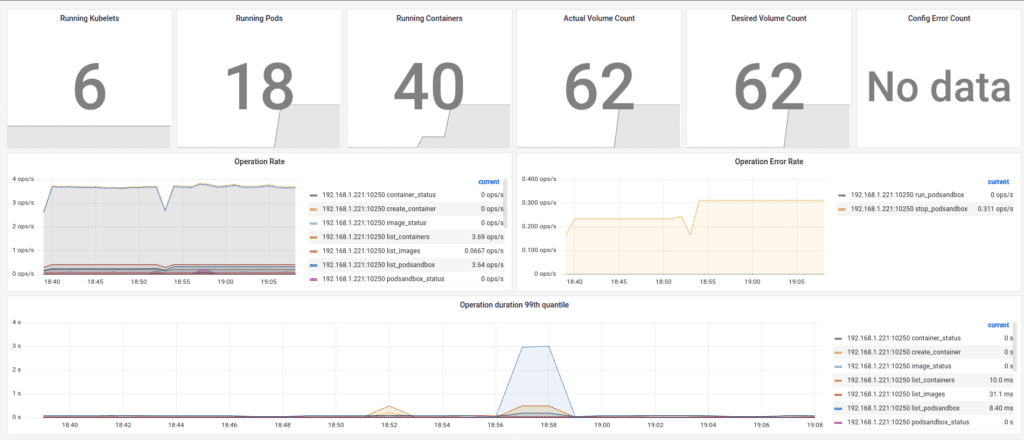
As part of Kubernetes Mixin, you get an excellent dashboard and alerts to monitor Kubelet. Additionally, you can track key indicators via the following PromQL queries:
Latency:
histogram_quantile(0.99, sum(rate(kubelet_pod_start_duration_seconds_bucket{}[5m])) by (le))Errors:
sum(rate(kubelet_started_pods_errors_total{}[5m]))Operations:
sum(rate(started_pods_total{}[5m])When there are issues with starting Pods, it’s helpful to investigate Kubelet’s other components, such as Pod workers, PLEG, volumes manager, Kubernetes API Client, and CRI client. These internal component metrics typically help you troubleshoot when Kubelet starts misbehaving.
References
- https://kubernetes.io/docs/setup/best-practices/cluster-large/
- https://kubernetes.io/docs/reference/command-line-tools-reference/kubelet-tls-bootstrapping/#certificate-rotation
- https://developers.redhat.com/blog/2019/11/13/pod-lifecycle-event-generator-understanding-the-pleg-is-not-healthy-issue-in-kubernetes#monitoring_relist
- https://containerd.io/
- https://cri-o.io/
- https://github.com/kubernetes/cri-api/blob/release-1.23/pkg/apis/runtime/v1/api.proto
- https://github.com/container-storage-interface/spec/blob/master/spec.md
- https://github.com/ceph/ceph-csi
- https://github.com/containernetworking/cni/blob/spec-v1.0.0/SPEC.md
- https://github.com/kubernetes/design-proposals-archive/blob/main/node/pod-lifecycle-event-generator.md
- https://kubernetes.io/docs/tasks/configure-pod-container/static-pod/
- https://github.com/kubernetes/community/blob/master/sig-scalability/slos/pod_startup_latency.md
