Introduction
I’ve been playing around with building Grafana dashboards for Kubernetes Administrators. There are few things I always wanted to go and see visually as a multiple Kubernetes cluster owner and maintainer. Firstly, I want to have proper Grafana dashboards for Kubernetes Control Plane and Node components: kube-api, kube-scheduler, kube-controller-manager as well as: kubelet & kube-proxy. Secondly, I want theses dashboards to be in GitHub, so that people can create issues & pull requests, update them (`git pull`) and help me maintain them.
Understanding Kubernetes & using my dashboards is a great exercise for Certified Kubernetes Administrators. You are not Certified Kubernetes Administrator yet? Definitely check the certification out, I am CKA myself and trust me you will learn a lot.
Sharing Grafana Dashboards
The current mainstream way of sharing Grafana dashboards is thru grafana.com/dashboards. You go to their page, find a proper dashboard, copy its ID and then click import in your local Grafana installation. Although it’s really easy to import a dashboard, my experience has taught me it can be difficult for most people to use. There are a couple of reasons why dashboards aren’t so great.
Firstly, people use different label selectors to choose the correct Prometheus target. Secondly, new versions of Prometheus exporters and applications exposing metrics change metric names or remove them. Thirdly, it’s really hard to find high-quality dashboards; you never know what you will end up with while importing. Then, after choosing your dashboard, you have to go thru all the graphs and edit metrics and label selectors, which means a lot of manual work for everyone.
Monitoring Mixins
There is a really cool project called Monitoring Mixins with an “ecosystem” built around solving these pain points. Fredic Branczyk has come up with the idea and written the initial proposal. It’s a really good read so definitely check out the Monitoring Mixins proposal. Furthermore, he also thought about how we could actually update our dashboards and pull them out from different GitHub repositories. It’s very similar to go get and I love it. Check out the initial design doc about Monitoring Mixin package manager named jsonnet-bundler. And HUUUGE thank you to Fredric!
Kubernetes Grafana mixin
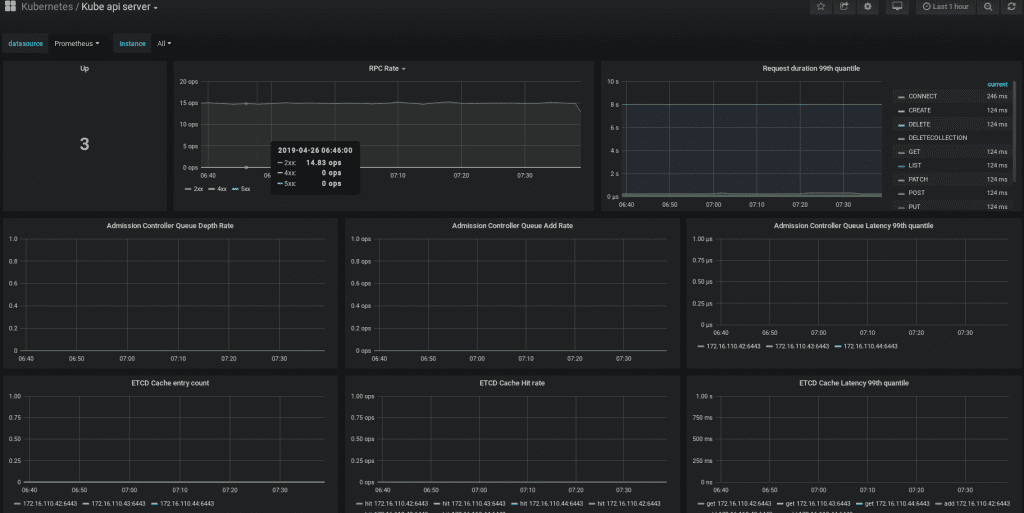
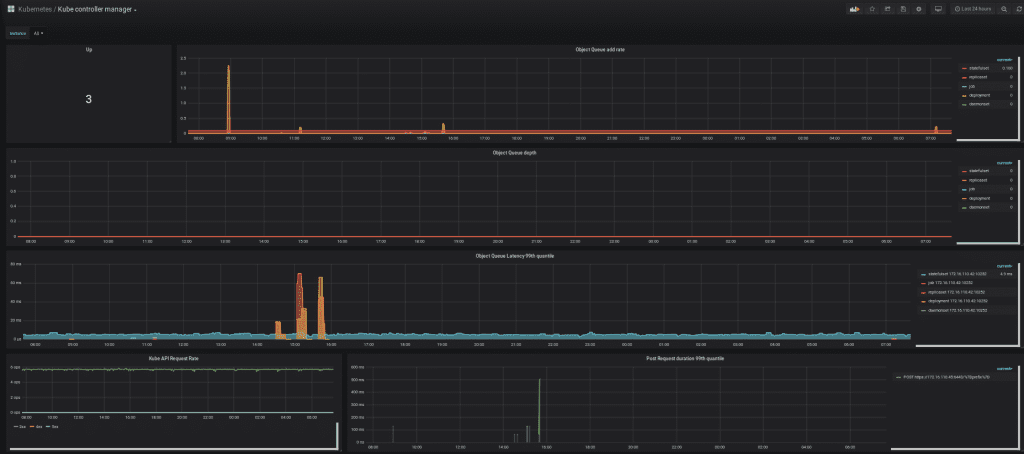
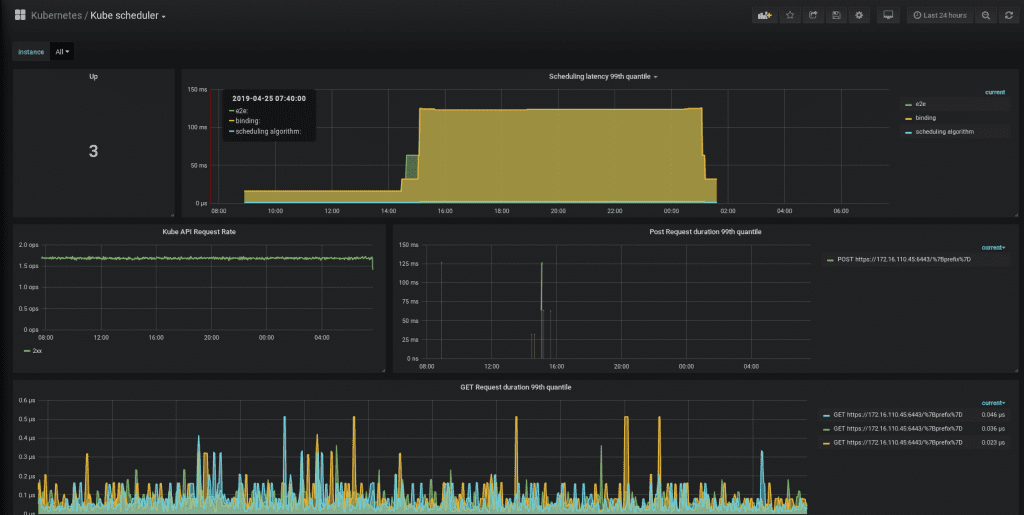
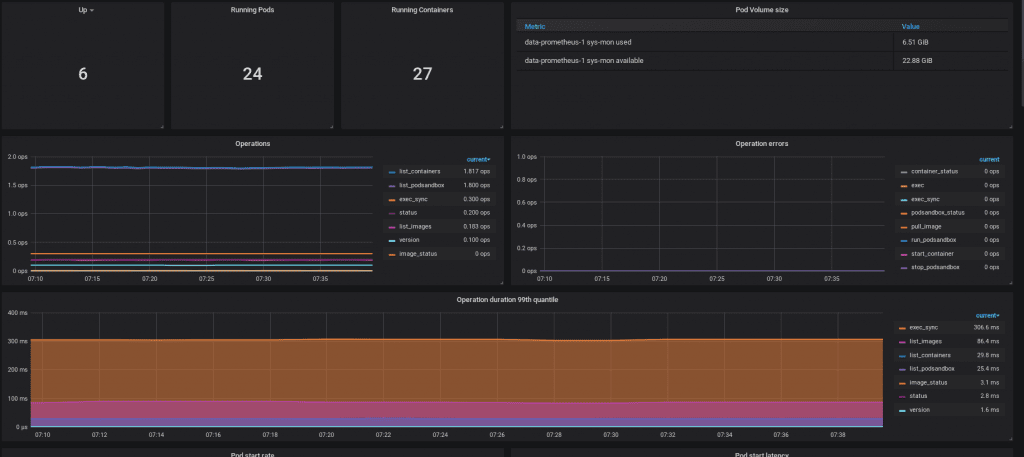
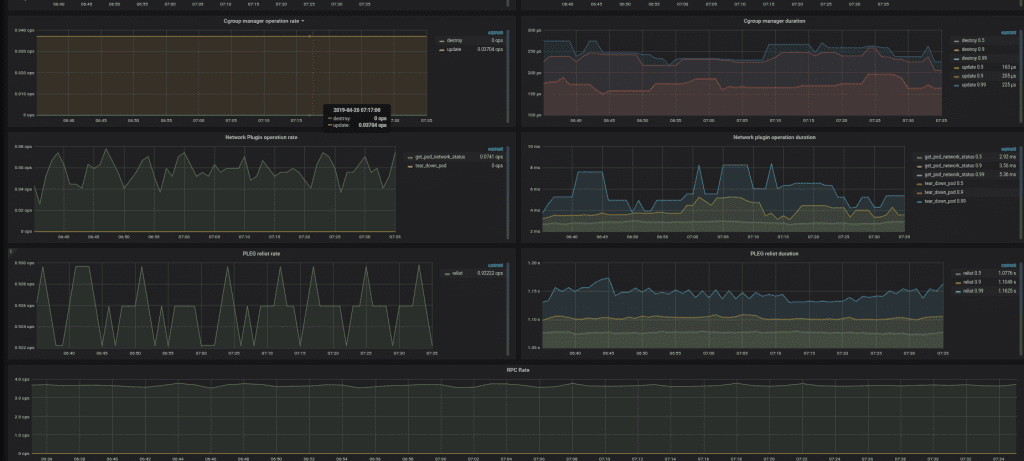
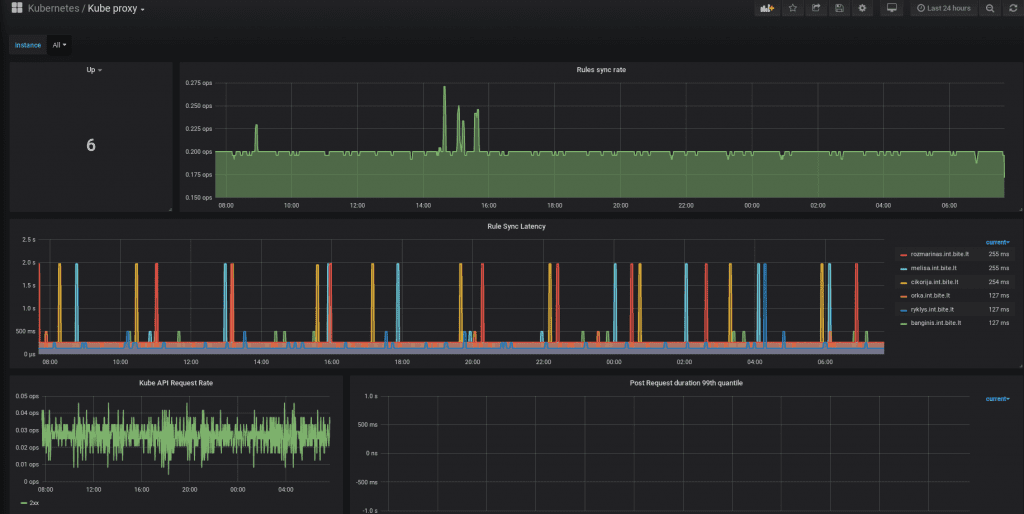
If you got this far, you deserve a break 😀 So here is some eye candy for you to enjoy 😛
API Server
Controller manager
Scheduler
Kubelet
Kube Proxy
Using Kubernetes Grafana Mixin
Firstly you will need to setup jsonnet and jsonnet-bundler.
Jsonnet
If you are on Mac OS, you can brew install jsonnet. Otherwise, the best approach is to compile it yourself.
Jsonnet bundler
[web_code] go get -u github.com/jsonnet-bundler/jsonnet-bundler/cmd/jb [/web_code]Building the dashboards
Create a new project directory, cd into it.
Now you can go get the mixin:
[web_code] jb init jb install https://github.com/povilasv/kubernetes-grafana-mixin [/web_code]Now create a new file called config.libsonnet.
This will import the dashboard and override job selectors.
Adjust the Prometheus label selectors to your actual environment.
Now create a dashboards directory. And finally call jsonnet to compile config.libsonnet:
This should output:
dashboards/kube-apiserver.json
dashboards/kube-controller-manager.json
dashboards/kube-proxy.json
dashboards/kube-scheduler.json
dashboards/kubelet.json
Result
List your dashboards directory.
[web_code] ls -l dashboards [/web_code]-rw-r--r-- 1 povilasv povilasv 35746 Apr 26 08:29 kube-apiserver.json
-rw-r--r-- 1 povilasv povilasv 34790 Apr 26 08:29 kube-controller-manager.json
-rw-r--r-- 1 povilasv povilasv 62845 Apr 26 08:29 kubelet.json
-rw-r--r-- 1 povilasv povilasv 27673 Apr 26 08:29 kube-proxy.json
-rw-r--r-- 1 povilasv povilasv 25650 Apr 26 08:29 kube-scheduler.jsonAdding Dashboards to Grafana
As I said before, I highly recommend you provision these dashboards via config files. You can read more about it in Grafana docs.
That said, nothing stops you going thru Grafana UI and adding them there.
Updating Dashboards
After some time passes, there will be changes to the dashboards. In order to update you need to execute:
[web_code] jb update [/web_code]That’s all for today.
I hope you like these dashboards. I’m going to do another blog post on how and why I did them the way I have, so please subscribe to my mailing list. Subscribers get to see my work before it goes public 🙂
If you use the dashboards, I would really like to hear back from you. Did you find it useful? Did it help you in an on-call situation? Just post a comment!
Check out Kubernetes Administrator certification, I highly recommend it! You will learn a lot.
Quality open source is really important to me. kuberntes-grafana-mixin is available using permissive Apache 2 license. If you like it, please give it a star on github!
Thanks for reading & see you next time!
