I’m constantly learning Go & just finished reading The Go Programming Language & Go in Action books, so I decided to learn a bit more about Go internals and since it was long time that somebody wrote about Go scheduler, I though it would be an interesting post. So, let’s get to it!
Basics
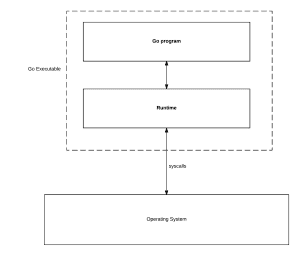
The Go runtime manages scheduling, garbage collection, and the runtime environment for goroutines. Here, I will focus only on the scheduler.
Runtime scheduler runs goroutines by mapping them onto operating system threads. Goroutines are lightweight version of threads, with very low cost of starting up. Each goroutine is described by a struct called G, which contains fields necessary to keep track of its stack and current status. So, G = goroutine.
Runtime keeps track of each G and maps them onto Logical Processors, named P. P can be seen as a abstract resource or a context, which needs to be acquired, so that OS thread (called M, or Machine) can execute G .
You can control how many logical processor your runtime has by calling runtime.GOMAXPROCS(numLogicalProcessors), if you are planning to tweak this parameter (you probably shouldn’t), set it once and forget it, because it needs “stop the world” GC pause.
Essentially, Operating System runs threads, which runs your code. The Go’s trick is that compiler inserts calls into Go runtime in various places, e.g. sending a value thru the channel, making a call to runtime package), so that Go can notify scheduler and take action.

Note: Idea for figure below taken from Analysis of the Go runtime scheduler.
The dance between Ms, Ps & Gs
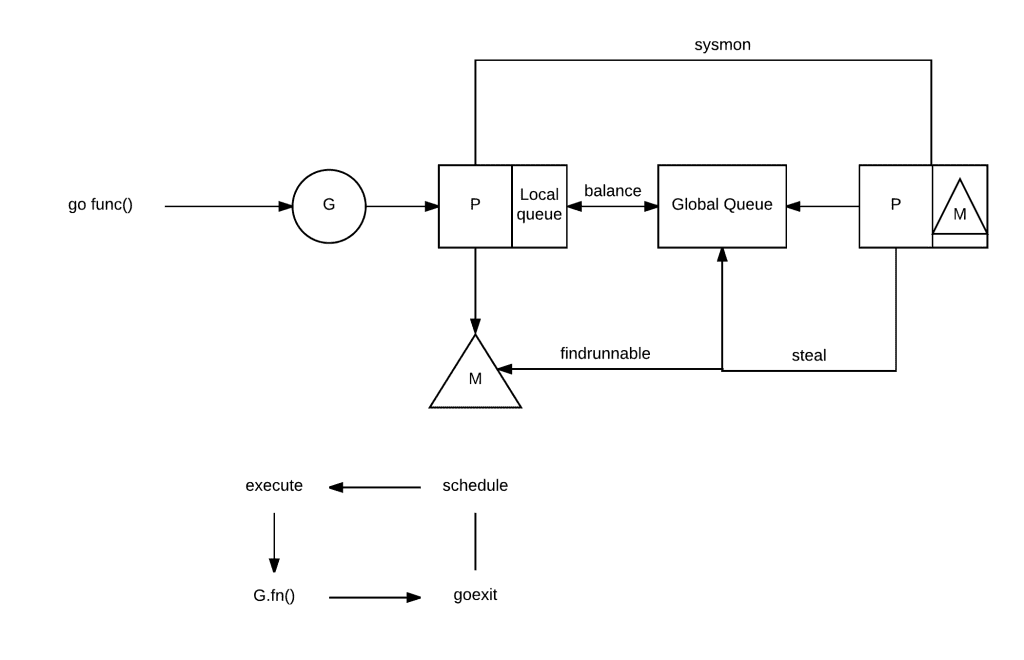
The interaction between Ms, Ps & Gs is a bit complicated. Take a look at this amazing workflow graph, which is from go runtime scheduler slides by Gao Chao.

Here we can see, that there are two types of queues for G: a global queue in the schedt struct (which is rarely used) and each P maintains a queue of runnable G‘s.
In order to execute a goroutine, M needs to be holding context P. Machine, then just pops it’s P queue of goroutines and executes code.
When you schedule a new goroutine (do a go func() call) it is placed into P‘s queue. There is this interesting work-stealing scheduling algorithm, which runs when M finishes executing some G and then it tries to take another G out of a queue, which is empty, then it randomly chooses another P and tries to steal a half of runnable G’s from it!
Interesting things happen when your goroutine makes a blocking syscall. Blocking syscall will be intercepted, if there are Gs to run, runtime will detach the thread from the P and create a new OS thread (if idle thread doesn’t exist) to service that processor.
When a system calls resumes, the goroutine is placed back into a local run queue and the thread will park itself (meaning thread won’t be running) and insert itself in the list of idle threads.
If a goroutine makes a network call, runtime will do a similar action. The call will be intercepted, but because Go has integrated network poller, which has its own thread, it will be assigned to it.
Essentially Go runtime will run a different goroutine, if current goroutine is blocked on:
- blocking syscall (for example opening a file),
- network input,
- channel operations,
- primitives in the sync package.
Scheduler Tracing
Go allows to trace runtime scheduler. This is done via GODEBUG environment variable:
[web_code] GODEBUG=scheddetail=1,schedtrace=1000 ./program [/web_code]Here is an example of output it gives:
SCHED 0ms: gomaxprocs=8 idleprocs=7 threads=2 spinningthreads=0 idlethreads=0 runqueue=0 gcwaiting=0 nmidlelocked=0 stopwait=0 sysmonwait=0
  P0: status=1 schedtick=0 syscalltick=0 m=0 runqsize=0 gfreecnt=0
  P1: status=0 schedtick=0 syscalltick=0 m=-1 runqsize=0 gfreecnt=0
  P2: status=0 schedtick=0 syscalltick=0 m=-1 runqsize=0 gfreecnt=0
  P3: status=0 schedtick=0 syscalltick=0 m=-1 runqsize=0 gfreecnt=0
  P4: status=0 schedtick=0 syscalltick=0 m=-1 runqsize=0 gfreecnt=0
  P5: status=0 schedtick=0 syscalltick=0 m=-1 runqsize=0 gfreecnt=0
  P6: status=0 schedtick=0 syscalltick=0 m=-1 runqsize=0 gfreecnt=0
  P7: status=0 schedtick=0 syscalltick=0 m=-1 runqsize=0 gfreecnt=0
  M1: p=-1 curg=-1 mallocing=0 throwing=0 preemptoff= locks=1 dying=0 helpgc=0 spinning=false blocked=false lockedg=-1
  M0: p=0 curg=1 mallocing=0 throwing=0 preemptoff= locks=1 dying=0 helpgc=0 spinning=false blocked=false lockedg=1
  G1: status=8() m=0 lockedm=0
Note that it uses the same concepts of G, M & P and their state, such as P’s queue size. Usually, you don’t need that much detail, so you can just use:
[web_code] GODEBUG=schedtrace=1000 ./program [/web_code]There is this great article by William Kennedy, which explains how to interpret this and the detailed version of the trace.
Also, there is an advanced tool called go tool trace, which has an UI and allows you to explore, what your program and runtime is doing. You can read how to use it in Pusher article.
References:
