Previously on povilasv.me, we explored Go Memory Management and Go Memory Management part 2. In last blog post, we found that when using cgo, virtual memory grows. In this post we will deep dive into cgo.
Learning Go? Check out The Go Programming Language & Go in Action books. These books have greatly helped when I was just starting with Go. If you like to learn by example, definitely get the Go in Action.
CGO internals
So as we can see, once we start using cgo virtual memory grows. Moreover for most users the switch to cgo happens automatically, once they import net package or any package net‘s child package (like http).
I found a lot of documentation on how cgo calls work inside actualstandard library code. For example looking into cgocall.go, you will find, really helpful comments:
To call into the C function f from Go, the cgo-generated code calls runtime.cgocall(_cgo_Cfunc_f, frame), where _cgo_Cfunc_f is a gcc-compiled function written by cgo.
runtime.cgocall (below) calls entersyscall so as not to block other goroutines or the garbage collector, and then calls runtime.asmcgocall(_cgo_Cfunc_f, frame).
runtime.asmcgocall (in asm_$GOARCH.s) switches to the m->g0 stack (assumed to be an operating system-allocated stack, so safe to run gcc-compiled code on) and calls _cgo_Cfunc_f(frame).
_cgo_Cfunc_f invokes the actual C function f with arguments taken from the frame structure, records the results in the frame, and returns to runtime.asmcgocall.
After it regains control, runtime.asmcgocall switches back to the original g (m->curg)’s stack and returns to runtime.cgocall.
After it regains control, runtime.cgocall calls exitsyscall, which blocks until this m can run Go code without violating the $GOMAXPROCS limit, and then unlocks g from m.
The above description skipped over the possibility of the gcc-compiled function f calling back into Go. If that happens, we continue down the rabbit hole during the execution of f.
cgocall.go source (https://golang.org/src/runtime/cgocall.go)
The comments go even deeper about how go implements a call from cgo to go. I encourage you to explore the code and the comments. I learnt a lot by looking under the covers. From these comments, we can see that behavior is completely different when Go calls out to C vs when it doesn’t.
Runtime Tracing
One cool way of exploring Go behaviour, is to use Go runtime tracing. Checkout Go Execution Tracer blog post for more detailed information around Go tracing. For now, let’s change our code to add tracing:
[web_code] func main() { trace.Start(os.Stderr) cs := C.CString(“Hello from stdio”) time.Sleep(10 * time.Second) C.puts(cs) C.free(unsafe.Pointer(cs)) trace.Stop() } [/web_code]Let’s build it and forward standard error output to a file:
[web_code] /ex7 2> trace.out [/web_code]Lastly, we can view the trace:
[web_code] go tool trace trace.out [/web_code]That’s it. Next time when I have weirdly behaving command line application I know how to trace it 🙂 By the way if you want to trace web server, GO has httptrace packge, which is even simpler to use. Checkout HTTP Tracing blog post for more information.
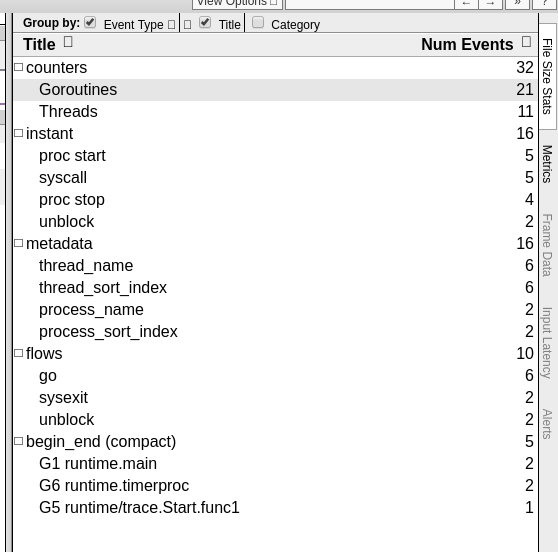
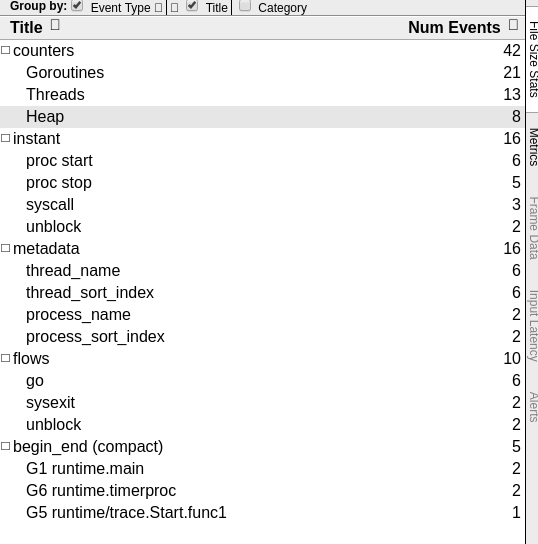
So I’ve compiled this program and a similar program without any C statements and compared the traces using go tool trace. This is how the go native code looks:
[web_code] func main() { trace.Start(os.Stderr) str := “Hello from stdio” time.Sleep(10 * time.Second) fmt.Println(str) trace.Stop() } [/web_code]There isn’t much difference between traces in cgo program & native go program. I’ve noticed that some stats are a bit different. For example, cgo program didn’t include Heap profile in trace section.
I explored a bunch of different views, but didn’t see any more significant differences. My guess is that Go doesn’t add traces for compiled C code.
So I decided to explore the differences using strace.
Exploring cgo with strace
Just to clarify we will be exploring 2 programs, both of them are sort of doing the same thing. The same exact programs, just go tracing removed.
cgo program:
[web_code] func main() { cs := C.CString(“Hello from stdio”) time.Sleep(10 * time.Second) C.puts(cs) C.free(unsafe.Pointer(cs)) } [/web_code]Go native program:
[web_code] package main import ( “fmt” “time” ) func main() { str := “Hello from stdio” time.Sleep(10 * time.Second) fmt.Println(str) } [/web_code]To strace those programs, build them and run:
[web_code] sudo strace -f ./program_name [/web_code]I’ve added -f flag, which will make strace to also follow threads.
-f Trace child processes as they are created by currently traced processes as a result of the fork(2), vfork(2) and clone(2) system calls.
cgo results
As we saw previously cgo programs load libc & pthreads C libraries in order to perform their work. Also, as it turns out, cgo programs create threads differently. When a new thread is created, you would see a call to allocate 8mb of memory for Thread stack:
mmap(NULL, 8392704, PROT_NONE, MAP_PRIVATE|MAP_ANONYMOUS|MAP_STACK, -1, 0) = 0x7f1990629000
// We allocate 8mb for stack
mprotect(0x7f199062a000, 8388608, PROT_READ|PROT_WRITE) = 0
// Allow to read and write, but no code execution in this memory region.
After stack is setup, you would see a call to clone system call, which would have different arguments than a typical go native program:
clone( child_stack=0x7f1990e28fb0, flags=CLONE_VM|CLONE_FS|CLONE_FILES|CLONE_SIGHAND|CLONE_THREAD|CLONE_SYSVSEM|CLONE_SETTLS|CLONE_PARENT_SETTID|CLONE_CHILD_CLEARTID, parent_tidptr=0x7f1990e299d0, tls=0x7f1990e29700, child_tidptr=0x7f1990e299d0) = 3600IF you are intresetd what those arguments mean, check out their descriptions below (taken from clone man pages):
CLONE_VM – the calling process and the child process run in the same memory space.The arguments here:
man pages for clone system call
CLONE_FS – the caller and the child process share the same filesystem information.
CLONE_FILES – the calling process and the child process share the same file descriptor table.
CLONE_SIGHAND – the calling process and the child process share the same file descriptor table.
CLONE_THREAD – the child is placed in the same thread group as the calling process.
CLONE__SYSVSEM – then the child and the calling process share a single list of System V semaphore adjustment values.
CLONE_SETTLS – The TLS (Thread Local Storage) descriptor is set to newtls.
CLONE_PARENT_SETTID – Store the child thread ID at the location ptid in the parent’s memory.
CLONE_CHILD_CLEARTID – Store the child thread ID at the location ctid in the child’s memory.
After a clone call, a thread would reserve 128mb of ram, then unreserve 57.8mb and 8mb. Take a look at the strace section below:
mmap(NULL, 134217728, PROT_NONE, MAP_PRIVATE|MAP_ANONYMOUS|MAP_NORESERVE, -1, 0) = 0x7f1988629000
//134217728 / 1024 / 1024 = 128 MiB
munmap(0x7f1988629000, 60649472 )
// Remove memory mapping from 0x7f1988629000 to + 57.8 MiB
munmap(0x7f1990000000, 6459392)
// Remove memory mapping from 0x7f1990000000 to + 8 MiB
mprotect(0x7f198c000000, 135168, PROT_READ|PROT_WRITE
Now this totally makes sense. In cgo programs we saw around 373.25 MiB virtual memory and this 100% explains it. Even more it actually explains why I haven’t seen the memory mappings in /proc/PID/maps in the first part of the article. It’s threads reserving the memory and they have their own PIDs. In addition, as threads do a call to mmap, but never actually use that memory region, this won’t be accounted in resident set size, but would be in virtual memory size.
Let’s do some napkin calculations:
There was 5 calls to clone system call in strace output. This reserves 8mib for stack + 128 MiB, then unreserves 57.8 MiB and 8 Mib. This ends up in ~70 MiB per thread. Also one thread actually reserved 128 MiB but didn’t unmap anything and another one didn’t unmap 8 MiB. So the calculation looks as follows:
4 * 70 + 8 + 1 * 128 = ~ 416 MiB.
Additionally let us not forget that there is some additional memory reservations on program initialization. So + some constant.
Obviously it’s super hard to figure out at which point we sampled the memory (executed ps), i.e. we could have executed ps only when 2 or 3 threads were running, memory could have been mmaped but not released, etc. So, in my opinion this is the explanation I was looking for when I originally started the Go Memory Management blog post.
If you are interested what those arguments to mmap mean, here are the definitions:
MAP_ANONYMOUS – The mapping is not backed by any file; its contents are initialized to zero.
man pages for mmap system call
MAP_NORESERVE – Do not reserve swap space for this mapping.
MAP_PRIVATE – Create a private copy-on-write mapping. Updates to the mapping are not visible to other processes mapping the same file, and are not carried through to the underlying file.
Lastly, let’s take a look how native go programs create threads.
Go native results
In go native code there were only 4 calls to clone system calls. None of the newly created threads did memory allocation (there were no mmap calls). Additionally there were no 8MiB reservation for stack. This is roughly how go native creates a thread:
clone( child_stack=0xc420042000, flags=CLONE_VM|CLONE_FS|CLONE_FILES|CLONE_SIGHAND|CLONE_THREAD|CLONE_SYSVSEM) = 3935
Note the difference between go and cgo arguments for clone calls.
Additonally. in go native code you can clearly see the Println statement in strace:
[pid  3934] write(1, "Hello from stdio\n", 17Hello from stdio
) = 17
Somehow I couldn’t find a similar system call for fputs(), statement in cgo version.
What I love about native Go, is that strace output is way smaller and just easier to understand. There are generally less things happening. For instance strace for go native produced 281 lines of output, compared to 342 for cgo.
Conclusion
If there is something you can take away from my exploration is that:
- Go might auto-magically switch to cgo, if package that uses C is involved. For instance, net, net/http packages.
- Go has two DNS resolver implementations: netgo and netcgo.
- You can learn which DNS client you are using via export GODEBUG=netdns=1 environment variable.
- You can change them during runtime via export GODEBUG=netdns=go and export GODEBUG=netdns=go environment variables.
- You can compile with one DNS implementation via go build tags. go build -tags netcgo and go build -tags netgo.
- /proc filesystem is useful, but don’t forget about the threads!
- /prod/PID/status and /proc/PID/maps can be helpful to quickly dump, whats going on.
- Go Execution Tracer can help to debug your software.
- strace -f, when you don’t know what to do.
Finally:
- cgo is different from Go.
- Big virtual memory isn’t bad.
- Newer versions of Go behave differently, so what’s true for Go 1.10 isn’t for Go 1.12.
If you take anything from this blogpost, please just don’t take that you need to build go programs with CGO_ENABLED=0. There are reasons that Go authors decided to do the way it’s done. And this behavior might change in future as it changed for Go 1.12.
That’s it for the day. If you are interested to get my blog posts first, join the newsletter.
Thanks for reading & see you next time!