Did you know that Kubernetes Controller Manager can draw graphs?
But first, let’s start from the beginning.
The Kubernetes Controller Manager is a daemon that embeds the core Kubernetes controllers that act independently. Controllers watch the cluster’s shared state through the Kubernetes API Server and command changes to move the current state towards the desired state.
One of those controllers is a Garbage Collector controller. The Garbage Collector controller is responsible for deleting no longer needed resources in the Kubernetes Cluster. For example, let’s say you have a Pod managed by a Deployment resource in your cluster. But that Deployment resource got deleted, while Pod is still running. To clean resources like this Garbage Collector controller generates a dependency graph based on the Resource object’s owner references and gets rid of dangling resources like this.
What is unique about this Garbage Collector controller is that it implements Debuggable Interface. Here is what the Debuggable interface looks like:
// Debuggable defines a controller that allows the controller manager
// to expose a debugging handler for the controller
//
// If a controller implements Debuggable, and the returned handler is
// not nil, the controller manager can mount the handler during startup.
type Debuggable interface {
	// DebuggingHandler returns a Handler that expose debugging information
	// for the controller, or nil if a debugging handler is not desired.
	//
	// The handler will be accessible at "/debug/controllers/{controllerName}/".
	DebuggingHandler() http.Handler
}
So the Garbage Controller’s debugging handler is accessible via /debug/controllers/garbagecollector path.
Controller Manager exposes these debugging handlers via its operational port. By default, the Controller Manager listens on port 10257 for operational purposes. It provides many helpful HTTPS endpoints, such as:
/healthzfor checking Controller Manager’s health./debug/pproffor getting Go profiles./metricsfor metrics./debug/controllers/{controllerName}for controller debugging handlers.
What the Garbage Collector controller did special in the debugging handler is that it returns a graphviz graph on the /graph endpoint. You can test this yourself via the following command:
curl -k https://CONTROLLER-MANAGER-IP-HERE:10257/debug/controllers/garbagecollector/graph | dot -T svg > gc.svgThe command gives you a gc.svg file, which you can view in your browser. The following image shows a partial example of the generated graph:
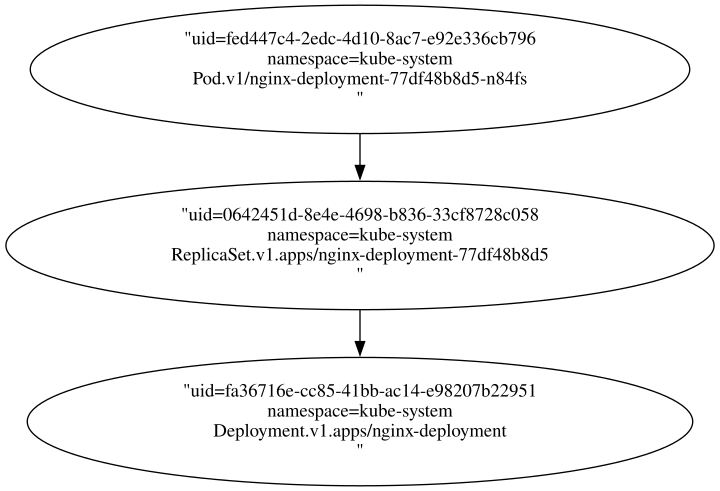
This graph shows the dependencies between objects in Kubernetes.
Additionally, you can pass a Resource uid to get a graph for a single resource. The following command shows this:
curl -k https://CONTROLLER-MANAGER-IP-HERE/debug/controllers/garbagecollector/graph\?uid\=fa36716e-cc85-41bb-ac14-e98207b22951 | dot -T svg > gc.svgMaking software draw a graph to debug is an exciting approach I haven’t seen before. Have you?