Introduction
Previously, I released Grafana Dashboards for Kubernetes Administrators. If you haven’t had the chance to read about it yet, please check out my post:
Grafana Dashboards for Kubernetes Administrators.
It seems to have been taken really well by the community, and a lot of people were sending in their thanks; no one actually submitted an issue. However, I did manage to find and fix one minor bug, which occurred while importing Scheduler dashboard into Grafana. It would complain about a used UID, but now it’s been fixed, and the process of using the dashboards should be rather straightforward.
kubernetes-mixin
Just like plants require repotting in order to grow bigger and stronger, I feel it’s time my project found a new home. Therefore, I decided to contribute my work to the kubernetes-monitoring/kubernetes-mixin project. This repository gives you standard Kubernetes Prometheus alerts, plus access to additional Grafana dashboards.

This project is actually maintained by people from Prometheus and it’s ecosystem projects, and a team is actually in the process of moving the project to Kubernetes SIG instrumentation. So, after everything is done, it will be part of Kubernetes – which is awesome!

So the way this will work is that kubernetes-mixin only support these dashboards from Kubernetes v1.14 and greater, users with prior version, should keep using my kubernetes-grafana-mixin. The reason for that is Kubernetes recently had a huge metric overhaul and supporting anything prior to that doesn’t really make sense.
I’ve already made a huge Pull Request to the team and converted those dashboards to v1.14. Pull Request has recently landed, so if you are using the mixin just jb update and you should get them.
In this post, I will walk you how to setup kubernetes-monitoring/kubernetes-mixin and if you used my mixin, how to migrate away from it.
Migration
If you followed my previous blog post, you should have ended up with a config.libsonnet file that looks something like:
We will reuse this config, while adding some additional things, considering kubernetes-mixin provides many more options.
Setup
If you haven’t tried my monitoring mixin yet, but you want to try this one, make sure you set up your environment.
You will need jsonnet:
If you are on Mac OS, you can brew install jsonnet.
Otherwise, you will have to compile from scratch:
git clone https://github.com/google/jsonnet.git jsonnet_git
cd jsonnet_git
make
sudo mv jsonnet /usr/local/bin/
Also, you will need jsonnet-bundler:
go get -u github.com/jsonnet-bundler/jsonnet-bundler/cmd/jbUsing Kubernetes Mixin
Let’s start with a new folder:
[web_code] mkdir my_mixin cd my_mixin [/web_code]Initialize json bundler & get mixin:
[web_code] jb init jb install https://github.com/kubernetes-monitoring/kubernetes-mixin [/web_code]Now, create a new file called config.libsonnet.
Edit the file:
[web_code] local kubernetes = import ‘kubernetes-mixin/mixin.libsonnet’; kubernetes { _config+:: { // Set these options to correct Prometheus jobs that are scraping these pods // Migrate your existing job selectors in here kubeletSelector: ‘job=”kubernetes-nodes2″‘, kubeSchedulerSelector: ‘job=”kube-scheduler2″‘, kubeControllerManagerSelector: ‘job=”kube-controller-manager2″‘, kubeApiserverSelector: ‘job=”kube-apiserver2″‘, kubeProxySelector: ‘job=”kube-proxy2″‘, kubeStateMetricsSelector: ‘k8s_app=”kube-state-metrics2″‘, cadvisorSelector: ‘job=”kubernetes-cadvisor2″‘, nodeExporterSelector: ‘job=”node-exporter2″‘, notKubeDnsSelector: ‘job!=”kube-dns2″‘, // If you are using Kubernetes with Windows Nodes set this to your Prometheus wmi-exporter job wmiExporterSelector: ‘job=”wmi-exporter”‘, // You can set some Grafana dashboard specific config grafanaK8s: { dashboardNamePrefix: ‘Kubernetes / ‘, dashboardTags: [‘kubernetes-mixin’], // For links between grafana dashboards, you need to tell us if your grafana // servers under some non-root path. linkPrefix: ‘ ‘, }, // Opt-in to multiCluster dashboards by overriding this and the clusterLabel. showMultiCluster: false, // There are more config options, checkout // https://github.com/kubernetes-monitoring/kubernetes-mixin/blob/master/config.libsonnet // But defaults are reasonable and should just work. }, } [/web_code]Change the config file according to your existing configuration. The label selectors are named the same way, so you can simply copy and paste the config.
Additionally, set the kube-state-metrics, node-exporter, cadvisor and wmi-exporter Prometheus scrape jobs.
kubernetes-mixin has Grafana dashboards, Prometheus alerts & recording rules. Let’s build them now!
Building Dashboards
Create a dashboards directory.
Call jsonnet to compile config.libsonnet Dashboards:
Output:
dashboards/k8s-cluster-rsrc-use.json
dashboards/k8s-node-rsrc-use.json
dashboards/k8s-resources-cluster.json
dashboards/k8s-resources-namespace.json
dashboards/k8s-resources-pod.json
dashboards/k8s-resources-workload.json
dashboards/k8s-resources-workloads-namespace.json
dashboards/kube-apiserver.json
dashboards/kube-controller-manager.json
dashboards/kube-proxy.json
dashboards/kube-scheduler.json
dashboards/kubelet.json
dashboards/nodes.json
dashboards/persistentvolumesusage.json
dashboards/pods.json
dashboards/statefulset.json
Now let’s do the same thing for alerts and recording rules.
Building Prometheus Alerts & Rules
Let’s create rules directory:
Build Prometheus Alerts:
[web_code] jsonnet -J vendor -S -e \ ‘std.manifestYamlDoc((import”config.libsonnet”).prometheusAlerts)’ \ > rules/alerts.yml [/web_code]Build Prometheus Recording Rules:
[web_code] jsonnet -J vendor -S -e \ ‘std.manifestYamlDoc((import “config.libsonnet”).prometheusRules)’ \ > rules/rules.yml [/web_code]Result
List your dashboards directory.
Output:
k8s-cluster-rsrc-use.json
k8s-node-rsrc-use.json
k8s-resources-cluster.json
k8s-resources-namespace.json
k8s-resources-pod.json
k8s-resources-workload.json
k8s-resources-workloads-namespace.json
kube-apiserver.json
kube-controller-manager.json
kubelet.json
kube-proxy.json
kube-scheduler.json
nodes.json
persistentvolumesusage.json
pods.json
statefulset.json
Also, checkout Prometheus alerts and recording rules in rules directory.
Output:
alerts.yml
rules.yml
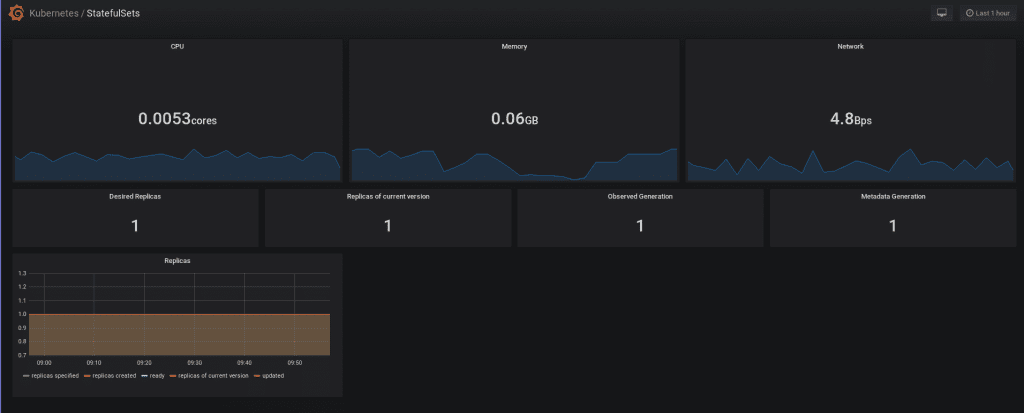
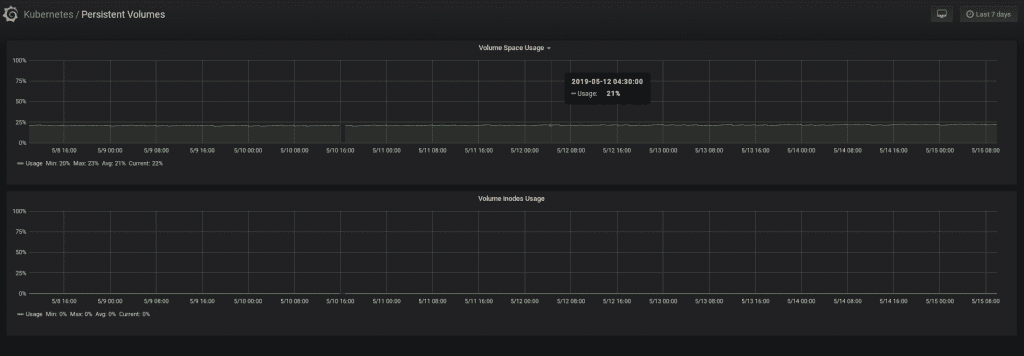
This is how generated alerts and dashboards look. Now, let’s take a look at how to use them.
Adding Dashboards to Grafana
I highly recommend you provision these dashboards via config files. You can read more about it in grafana docs.
In general, nothing stops you from going thru Grafana UI and adding them there, but you will have to do this every time you pull updates from mixin. I highly recommend spending some time on this by automating it using Grafana file provisioning.
Adding Rules to Prometheus
Just add those rules.yaml and alerts.yaml to your Prometheus config.
Again, I highly recommend provisioning these alerts automatically, instead of manually copying and pasting these files.
One option would be to add the git-sync container to hold these generated alerts in git.
⚠️ Make sure to tune your git-sync container for availability and retries. In the event the git server is not available, your git-sync container might crash – taking down your Prometheus with it.
Update Mixin
Lastly, after some time passes, you will need to update the alerts and dashboards.
In order to update you need to execute:
[web_code] jb update [/web_code]Cloning into 'vendor/.tmp/jsonnetpkg-kubernetes-mixin-master423253511'...
remote: Enumerating objects: 69, done.
remote: Counting objects: 100% (69/69), done.
remote: Compressing objects: 100% (50/50), done.
remote: Total 1241 (delta 32), reused 50 (delta 19), pack-reused 1172
Receiving objects: 100% (1241/1241), 5.12 MiB | 5.63 MiB/s, done.
Resolving deltas: 100% (776/776), done.
Already on 'master'
Your branch is up to date with 'origin/master'.
>>> Installed kubernetes-mixin version master
Cloning into 'vendor/.tmp/jsonnetpkg-grafonnet-master528337338'...
remote: Enumerating objects: 21, done.
remote: Counting objects: 100% (21/21), done.
remote: Compressing objects: 100% (18/18), done.
remote: Total 1402 (delta 5), reused 8 (delta 3), pack-reused 1381
Receiving objects: 100% (1402/1402), 822.94 KiB | 4.31 MiB/s, done.
Resolving deltas: 100% (812/812), done.
Already on 'master'
Your branch is up to date with 'origin/master'.
>>> Installed grafonnet version master
Cloning into 'vendor/.tmp/jsonnetpkg-grafana-builder-master181878225'...
remote: Enumerating objects: 115, done.
remote: Counting objects: 100% (115/115), done.
remote: Compressing objects: 100% (56/56), done.
remote: Total 5124 (delta 69), reused 99 (delta 58), pack-reused 5009
Receiving objects: 100% (5124/5124), 13.47 MiB | 7.29 MiB/s, done.
Resolving deltas: 100% (1579/1579), done.
Already on 'master'
Your branch is up to date with 'origin/master'.
>>> Installed grafana-builder version masterThen rebuild the dashboards and reconfigure alerts.
Conclusion
One thing to note is that I won’t remove my repository soon, so you have plenty of time to migrate. That being said, there won’t be any bug fixes or new additions there. If you want to make changes, please do them in kubernetes-mixin repository. If you have any suggestions or things we need to fix, we have an open issue around these dashboards, feel free to comment.
I spent a lot of time on these Dashboards; the first commit was on January 24th. I am super happy for these dashboards to get a new home, become properly maintained & open-sourced..
Thanks for reading & see you next time!
